
Peer-leading results, differentiated process
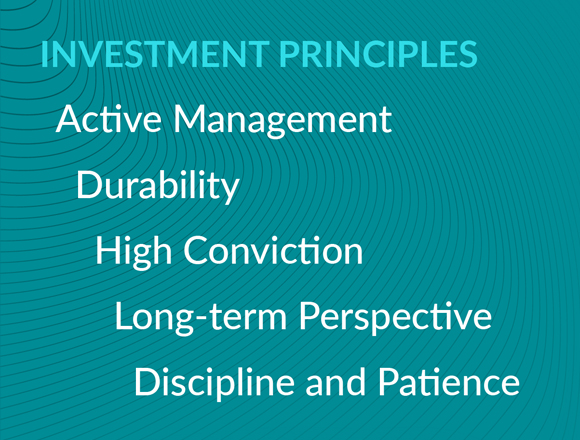
Our value proposition? Growing and preserving your capital by investing in durable credits when they’re available at attractive yields. As active managers, we build concentrated portfolios with high active shares, low turnover, and adequate liquidity. Our approach is grounded in three key insights:
- Credit valuations offer compensation well in excess of historical default-driven losses.
- Credit spreads are often more volatile than underlying fundamentals, providing a fertile environment for active management.
- Understanding the durability of a credit before economic challenges arise allows for disciplined decision-making through investment cycles.
Our Approach to Fixed Income Investing
Identifying durable investments through a value-conscious lens
We keep our pillars of fixed income investing at the center of everything we do. They drive us to make the best decisions for you as we partner in your success. Explore the deeper meaning behind each pillar below.
- Valuation
- Durability
- Heritage
Head of Municipal Fixed Income Greg Steier explains what we mean when we think about valuation and its importance in our fixed income investing strategy.
Credit research is foundational to our fixed income process. Head of Municipal Fixed Income Greg Steier discusses how we prioritize durability to help preserve your capital.
Head of Municipal Fixed Income Greg Steier discusses our heritage of fixed income investing, what partnership means to him, and the direct link between our analysts’ research and your portfolios’ success.
Our team and process have proved effective through a variety of market environments. Everything we do is with the objective of identifying value and preserving our clients’ capital.
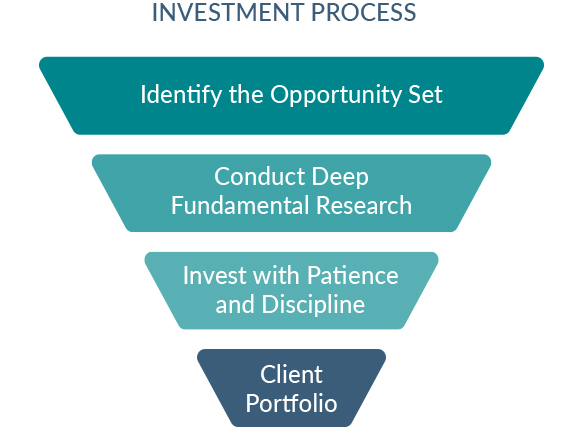
1. Identify the opportunity set: Narrow and rank the broad universe to the most qualified investments that meet our demanding set of qualitative and quantitative criteria.
2. Conduct deep fundamental research: Analyze the durability, management excellence, leverage, environmental, social, and governance (ESG) risks/opportunities, and transparency of targeted investments.
3. Let valuation drive portfolio construction: Opportunities that meet our stringent credit criteria are added to client portfolios and sized commensurate with their expected returns.
- We strive to identify strong absolute-value, not relative-value, opportunities.
- We are entirely bottom-up with a team-based approach emphasizing security selection.
- Our portfolio sector exposures take shape through a strict adherence to our valuation and credit criteria.
- We avoid large macroeconomic and directional positions that add volatility, but not return.

Fixed Income Strategies
How to Invest
Our investment strategies can be accessed through separately managed accounts (SMAs), mutual funds, UCITS funds, and private funds. To learn more please contact a member of our institutional relationship management team.
Visit the BBH Funds website and the BBH Luxembourg Funds website for more information about our public fund offerings.


The BBH Core Plus Fixed Income Strategy was previously called the BBH Core Fixed Income Strategy.
The BBH Multisector Fixed Income Strategy was previously called the Unconstrained Credit Fixed Income strategy.
This communication is for informational purposes only and does not constitute an offer or a solicitation to buy or sell any particular security or to adopt any specific investment strategy. The information herein has not been based on a consideration of any individual investor’s circumstances and is not investment advice, nor should it be construed in any way as tax, accounting, legal or regulatory advice. Any views and opinions are subject to change at any time.
This material does not constitute an offer or solicitation in any jurisdiction where or to any person to whom it would be unauthorized or unlawful to do so.
There is no assurance that the strategies will achieve their investment objective or that the strategies will work under all market conditions. The value of the portfolio can be affected by changes in interest rates, general market conditions and other political, social and economic developments. Each investor should evaluate their ability to invest for the long-term, especially during periods of downturn in the market.
Investing in the bond market is subject to certain risks including market, interest-rate, issuer, credit, maturity, call and inflation risk; investments may be worth more or less than the original cost when redeemed.
Investment Advisory Products and Services:
NOT FDIC INSURED NO BANK GUARANTEE MAY LOSE VALUE