

Chart depicting second quarter 2025’s yield plots for two-, five-, 10-, and 30-year yields from March 31 through June 30, 2025. In just three days, generic Triple-A 10-year yields increased 90 basis points.
Highlights
|
Under Pressure
Memories of the first quarter of 2025 vanished almost as quickly as municipal market liquidity in early April. The aftermath of President Trump’s Liberation Day tariff announcement evoked flashbacks to the COVID-19 pandemic. Concurrent with intense equity and Treasury market volatility, municipal investors sold in droves. Some sought the safety of cash, others sold to rebalance their fallen equity exposures, and there were even rumors of municipal bond sales to meet equity margin calls. Mutual fund and ETF redemptions exacerbated the selling frenzy. Irrespective of the reasons, the pressure of a serious liquidity vacuum was palpable. Beyond the market turmoil, investors grappled with the deficit implications of the One Big Beautiful Bill and the Moody’s downgrade of U.S. sovereign debt. As in past episodes of market turmoil, opportunities flourished, and we engaged with conviction.
In contrast, the Federal Reserve maintained a wait-and-see approach. Throughout the year, the Fed has found itself between a rock and a hard place, seeking to balance the growth and inflationary risks from tariffs. The pressure from President Trump on social media did not make things any easier. Today, investors expect two rate cuts by the end of the year, one in September and one in December. Despite pessimistic survey-based data, the economy has remained resilient, and inflation has continued to moderate. Although classic economics points to higher prices from tariffs, they have yet to materialize, and the Fed remains vigilant. In addition, 2026 will bring a new Fed Chair, likely a dovish one. Only time will tell the ramifications.
During the second quarter of 2025, high volatility, record-paced new issuance, and a steep yield curve with some of the highest long-term yields since the Global Financial Crisis brought a terrific investment environment. Choppy markets often generate attractive opportunities, and although we pride ourselves on being nimble, our heartrates spiked during early April. Even the quarter’s yield plots look suspiciously like an electrocardiogram. In just three days, generic Triple-A 10-year yields increased 90 basis points (bps)1, the rough equivalent of a seven-point price decline (see Exhibit I). By the end of the second quarter of 2025, the market stabilized, with short- and intermediate-maturity yields ending the quarter virtually unchanged. In contrast, long-maturity yields remained under pressure and finished higher.
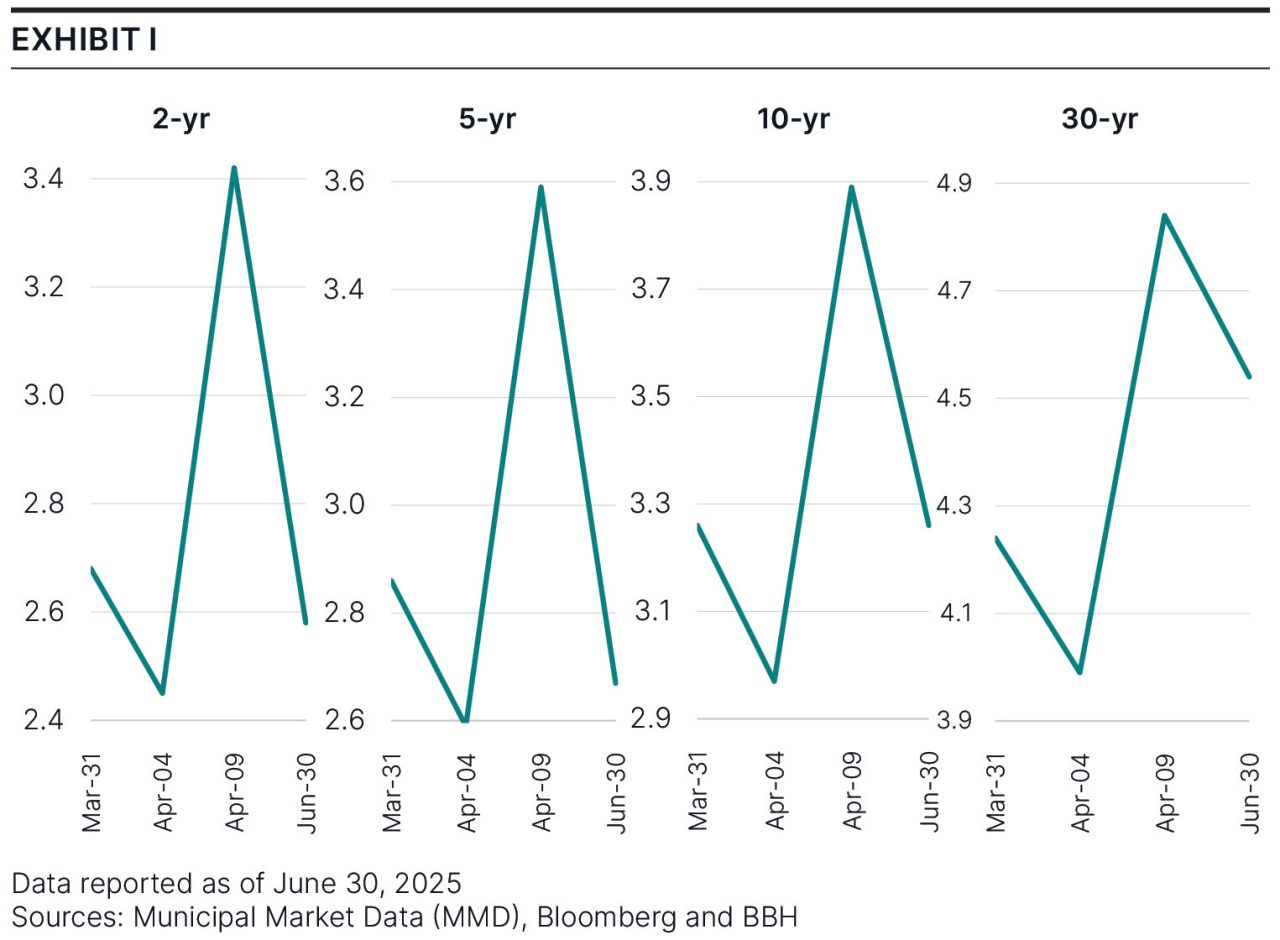
Exhibit II shows the persistent strength of short-maturity bonds and continued weakness of long-maturity bonds. Year-to-date (YTD) 15- to 20-year municipal-to-Treasury ratios have increased 15 percentage points to the mid-to-high 80% range. For the quarter, the intermediate index returned 0.8%, bringing its YTD total return to 1.8%. Our portfolios have benefited from their ongoing yield advantage and outperformed their benchmarks for both the quarter and YTD. Our holdings in state housing finance authorities, airports, and prepaid gas/energy remain major contributors to this advantage.
We note, however, that the yield curve exposure from our core holdings of floating rate notes and zero-coupon bonds detracted from our performance. Despite the volatility during the quarter, all investment-grade rating categories performed similarly. Even with growing economic and political risks, credit-sensitive bonds have remained firm, and we continue to find better values in niche sectors and in bonds with non-standard structures.
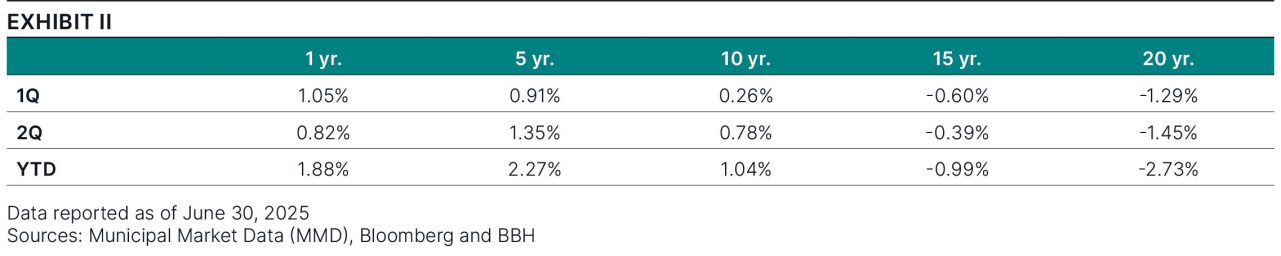
Table showing the persistent strength of short-term maturity bonds and continued weakness of long-maturity bonds in first quarter, second quarter, and year-to-date 2025. Year to date, 15- 20-year municipal-to-Treasury ratios have increased 15 percentage points.
We invested in a variety of opportunities during the quarter. In early May, the University of North Carolina at Chapel Hill (UNC) issued $250mn of floaters. UNC is a strong Triple-A rated credit which should be relatively unscathed by any federal cutbacks on research grants. As investors remained skittish, demand for the issue was light. We purchased 40% of the deal at a spread of 105 bps, far wider than the credit warranted. St. Cloud Independent School District No. 742, headquartered in St. Cloud, Minnesota, received a similarly tepid reaction to its $125mn new issue of zeros. The school district enjoys a high Double-A rating because of its backing from the state. We purchased 25% of the deal at an average spread of 80 bps for their intermediate maturities, which is attractive compensation for such a high-quality credit. We added several airports with spreads ranging between 80 and 100 bps, and housing PACs with spreads between 100 and 120 bps. Additionally, we added a range of longer maturities (15+ years) to eligible accounts at yields between 4.5% and 5.0% to take advantage of the recent underperformance of this part of the curve.
In addition to attractive yields, the steepening of the municipal yield curve has created substantial roll-down return benefits within intermediate maturities. Roll-down return results from the aging of securities. For example, as a 10-year bond ages, becoming a 9-year bond, the yield rolls down over the curve, and the bond appreciates in value. Roll-down is a reliable source of return, and it can be as high as 50 to 75 bps in certain maturities.
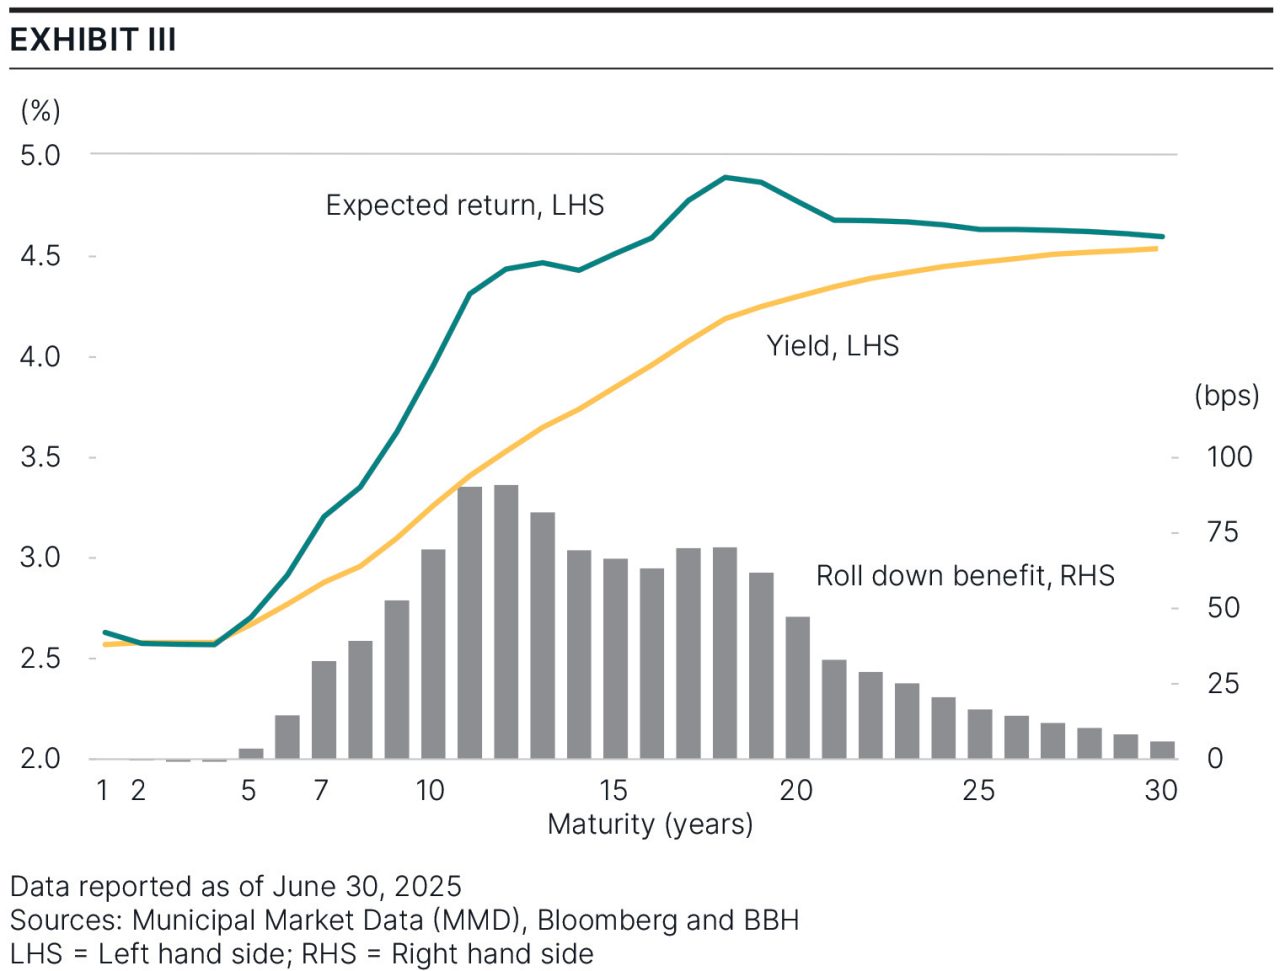
Chart showing the expected return and the roll-down benefit of the steeping municipal yield curve across one- to 30-year maturities. The steeping of the municipal yield curve has created substantial roll-down benefits within intermediate maturities.
Adding to the market’s current attractiveness, new issuance is poised to eclipse 2024’s record of $500bn. Through June 2025, municipal supply stood at $290bn, well above last year’s then-record pace. The desire to avoid potentially adverse legislation, the resumption of postponed projects, and increasing infrastructure costs have driven the surge in supply. School district issuance has soared 35% from last year, and within the revenue sector, healthcare, housing, and transportation have grown the most.
Depending on guideline flexibility, our intermediate portfolios yield 3.5% to 4.0%. At these levels, our portfolios would break even after a 100-bp yield increase over a 12-month horizon. We find that scenario unlikely, particularly with easier monetary policy on the horizon. On a pre-tax equivalent basis, for a top-bracket taxpayer, our intermediate municipal strategy yields 6% to 7%. That’s not far from many S&P 500 return estimates and a solid 2% over cash. We find compelling value in the municipal market, and we continue to advise clients to “extend to defend” their portfolio income. In other words, extend from the money markets into intermediate duration municipals to lock in today’s attractive yields.
We always get excited about purchasing high-quality credits that provide more income than they should, and carefully avoid those that do not. Prior to last year’s elections, municipal credit hit a high point. Today’s municipal credit valuations still reflect the high point they hit before the elections last year, despite a growing list of potential headwinds. Today, we face increasing economic risks from tariff uncertainties, which could have an outsized impact on seaport credits. Some universities face the risk of higher endowment taxes and grant reductions. Already operating on thin post-pandemic margins, healthcare institutions face potential pressure from Medicaid cuts. The housing market faces the potential privatization of Fannie Mae and Freddie Mac. States face pressure from potential federal funding cuts, a possible overhaul or elimination of the Federal Emergency Management Agency (FEMA), and the end of pandemic-related aid. The federal cash spigot, which has helped bolster credit since 2020, is closing. Whether, and to what extent, credit spreads will reflect this dynamic is a prediction we cannot reliably make. Instead, we will continue to conduct thorough research that contemplates a more difficult future.
At BBH, we choose process over predictions. This approach leads us to own issuers that are resilient to wide economic fluctuations as well as to political risk. Our first job is protecting against adverse credit outcomes. We then turn to our valuation analysis to ensure we receive higher yields than implied by underlying risks, including a safety margin against market volatility. As we often note, volatility is a feature of markets, not a bug. Volatile periods can be stressful and pressure-filled, but they are often ultimately fruitful. Our process gives us confidence to act with conviction during difficult periods, when many seeds are sown for strong future performance.

| Performance As of June 30, 2025 |
|||||||
|---|---|---|---|---|---|---|---|
|
Total Returns |
Average Annual Total Returns |
|||||
Composite/Benchmark |
3 Mo. |
YTD |
1 Yr. |
3 Yr. |
5 Yr. |
10 Yr. | Since Inception |
BBH Municipal Fixed Income Composite (gross of fees) |
1.01% |
1.67% |
3.61% |
3.91% |
1.63% |
2.74% |
3.62% |
BBH Municipal Fixed Income Composite (net of fees) |
0.95% |
1.54% |
3.35% |
3.66% |
1.38% |
2.48% |
3.37% |
Bloomberg 1-10 Yr. Municipal Bond Index |
1.04% |
1.75% |
3.48% |
2.67% |
0.96% |
1.96% |
3.16% |
Returns of less than one year are not annualized. Inception date: 05/01/2002. |
|||||||
| Past performance does not guarantee future results. Sources: BBH & Co and Bloomberg | |||||||
| Representative Account Top 10 Obligors As of June 30, 2025 |
|
|---|---|
South Carolina Mortgage Revenue Bonds |
2.8% |
Texas School Bond Guarantee Program |
2.5% |
Texas Department of Housing and Community Affairs Single Family Mortgage Revenue Bonds |
2.3% |
Illinois Housing Development Authority |
2.2% |
Houston Airport Enterprise, TX |
2.2% |
Texas Municipal Gas Corporation II |
2.1% |
Los Angeles Department of Water & Power, CA |
2.1% |
New Mexico Mortgage Finance Authority |
2.1% |
Southern Company |
2.1% |
Salt Verde Financial Corporation |
2.0% |
Total |
22.3% |
| Sources: BBH and Bloomberg | |
1Basis point (bp) is a unit that is equal to 1/100th of 1% and is used to denote the change in price or yield of a financial instrument.
Risks
There is no assurance that a portfolio will achieve its investment objective or that the strategy will work under all market conditions. The value of the portfolio can be affected by changes in interest rates, general market conditions and other political, social and economic developments. Each investor should evaluate their ability to invest for the long-term, especially during periods of downturn in the market.
Investing in the bond market is subject to certain risks including market, interest-rate, issuer, credit, maturity, call and inflation risk; investments may be worth more or less than the original cost when redeemed.
Income from municipal bonds may be subject to state and local taxes and at times the alternative minimum tax.
The Strategy also invests in derivative instruments, investments whose values depend on the performance of the underlying security, assets, interest rate, index or currency and entail potentially higher volatility and risk of loss compared to traditional stock or bond investments.
As the Strategy’s exposure in any one municipal revenue sector backed by revenues from similar types of projects increases, the Strategy will become more sensitive to adverse economic, business or political developments relevant to these projects.
The Representative Account is managed with the same investment objectives and employs substantially the same investment philosophy and processes as the strategy.
The objective of our Municipal Fixed Income Strategy is to deliver excellent after-tax returns in excess of industry benchmarks through market cycles. The Composite includes all fully discretionary fee-paying municipal fixed income accounts with an initial investment equal to or greater than $5 million that are managed to an average duration of approximately 4.5 years. Portfolios that subsequently fall below $4.5 million are excluded from the Composite.
Bloomberg 1-10 Year Municipal Bond Index is a component of the Bloomberg Municipal Bond index, including bonds with maturity dates between one and 17 years. The Bloomberg Municipal Bond Index is considered representative of the broad market for investment grade, tax-exempt bonds with a maturity of at least one year. One cannot invest directly in an index.
Bloomberg US Aggregate Bond Index is a market value-weighted index that tracks the daily price, coupon, pay-downs, and total return performance of fixed-rate, publicly placed, dollar-denominated, and non-convertible investment grade debt issues with at least $300 million par amount outstanding and with at least one year to final maturity.
Bloomberg US Corporate Bond Index measures the investment grade, fixed-rate, taxable corporate bond market. It includes USD-denominated securities publicly issued by US and non-US industrial, utility and financial issuers. The Index is a component of the US Credit and US Aggregate Indices.
“Bloomberg®” and the Bloomberg 1-10 Year Municipal Bond Index are service marks of Bloomberg Finance L.P. and its affiliates, including Bloomberg Index Services Limited (“BISL”), the administrator of the index (collectively, “Bloomberg”) and have been licensed for use for certain purposes by Brown Brothers Harriman & Co (BBH). Bloomberg is not affiliated with BBH, and Bloomberg does not approve, endorse, review, or recommend the BBH Strategy. Bloomberg does not guarantee the timeliness, accurateness, or completeness of any data or information relating to the fund.
Brown Brothers Harriman Investment Management (“IM”), a division of Brown Brothers Harriman & Co (“BBH”), claims compliance with the Global Investment Performance Standards (GIPS®). GIPS® is a registered trademark of CFA Institute. CFA Institute does not endorse or promote this organization, nor does it warrant the accuracy or quality of the content contained herein.
To receive additional information regarding IM, including a GIPS Composite Report for the strategy, contact John Ackler at 212 493-8247 or via email at john.ackler@bbh.com.
Gross of fee performance results for this composite do not reflect the deduction of investment advisory fees. Actual returns will be reduced by such fees. “Net” of fees performance results reflect the deduction of the maximum investment advisory fees. Returns include all dividends and interest, other income, realized and unrealized gain, are net of all brokerage commissions, execution costs, and without provision for federal or state income taxes. Results will vary among client accounts. Performance calculated in U.S. dollars.
Holdings are subject to change.
Credits: Obligations such as bonds, notes, loans, leases and other forms of indebtedness, except for Cash and Cash Equivalents, issued by obligors other than the U.S. Government and its agencies, totaled at the level of the ultimate obligor or guarantor of the Obligation.
Issuers with credit ratings of AA or better are considered to be of high credit quality, with little risk of issuer failure. Issuers with credit ratings of BBB or better are considered to be of good credit quality, with adequate capacity to meet financial commitments. Issuers with credit ratings below BBB are considered speculative in nature and are vulnerable to the possibility of issuer failure or business interruption.
Opinions, forecasts, and discussions about investment strategies represent the author’s views as of the date of this commentary and are subject to change without notice. References to specific securities, are for illustrative purposes only and are not intended to be, and should not be interpreted as recommendations.
Brown Brothers Harriman & Co. (“BBH”) may be used to reference the company as a whole and/or its various subsidiaries generally. This material and any products or services may be issued or provided in multiple jurisdictions by duly authorized and regulated subsidiaries. This material is for general information and reference purposes only and does not constitute legal, tax or investment advice and is not intended as an offer to sell, or a solicitation to buy securities, services or investment products. Any reference to tax matters is not intended to be used, and may not be used, for purposes of avoiding penalties under the U.S. Internal Revenue Code, or other applicable tax regimes, or for promotion, marketing or recommendation to third parties. All information has been obtained from sources believed to be reliable, but accuracy is not guaranteed, and reliance should not be placed on the information presented. This material may not be reproduced, copied or transmitted, or any of the content disclosed to third parties, without the permission of BBH. All trademarks and service marks included are the property of BBH or their respective owners. © Brown Brothers Harriman & Co. 2025. All rights reserved. IM-16840-2025-07-09
NOT FDIC INSURED NO BANK GUARANTEE MAY LOSE MONEY