

Chart depicting total trade (exports and imports) as a percentage of gross domestic product (GDP) for Hong Kong, Singapore, Ireland, Vietnam, Switzerland, Sweden, Poland, Germany, Mexico, France, Canada, the United Kingdom, Japan, India, Indonesia, China, Brazil, Argentina, and the U.S. As of 2024, the latest figures are 360%, 322%, 246%, 174%, 134%,106%, 100%, 79%, 75%, 68%, 65%, 63%, 46%, 45%, 43%, 37%, 35%, 28%, and 25%, respectively.
When the definitive history of the global economy at the turn of the 21st century is written, the 30 years between 1990 and 2020 will stand out as an unprecedented, and possibly unwarranted, pax economica. For three decades, globalization defined the economic paradigm. From the fall of the Berlin Wall in 1989 through the 2010s, the world economy became increasingly integrated, interconnected, and interdependent. Global trade as a percentage of world gross domestic product (GDP) rose from roughly 39% in 1990 to a peak of 61% in 2008, before settling around 58% by 2019. China’s accession to the World Trade Organization (WTO) in 2001 accelerated this integration, with the country’s share of global exports surging from 4% to nearly 15% by 2020. Supply chains stretched across continents, optimized for efficiency rather than resilience. Capital flowed freely across borders, seeking the highest returns in an increasingly borderless financial system. The proliferation of free trade agreements – from the North American Free Trade Agreement (NAFTA) to the EU’s single market expansion – reflected a broad consensus that lowering barriers would lift all boats.
This era delivered remarkable outcomes: hundreds of millions lifted from poverty, particularly in emerging Asia; declining prices for consumer goods in developed markets; and unprecedented corporate profit margins as companies accessed low-cost labor and production and met the needs of expanding markets. Yet the seeds of fragmentation were always present. The 2008 global financial crisis (GFC) exposed vulnerabilities in interconnected financial systems. Rising inequality within nations fueled populist movements skeptical of trade. And geopolitical tensions, particularly between the U.S. and China, introduced security considerations that trumped pure economic efficiency.
The sustainability of this period of economic globalization and growth is now seriously in question. The COVID-19 pandemic laid bare the brittleness of just-in-time supply chains, raising the appeal of just-in-case inventory management. Russia’s invasion of Ukraine in 2022 showed that kinetic war in Europe was a modern reality, not just a historical artifact. And the Trump administration has demonstrated that tariffs are economic tools to be used against friend and foe alike.
Globalization is not going away, although the character and paths of trade are shifting. We now stand at an inflection point where the global economy is fracturing into regional blocs defined by geography, security alliances, and shared values. Understanding this transformation is essential for navigating the decade ahead.
Economic implications
The shift toward regionalization carries profound implications for global economic growth, and the effects are likely to be predominantly negative in the aggregate, though distributed unevenly across regions and sectors. The fundamental economic logic is straightforward: Globalization allowed countries to exploit comparative advantage, achieve specialization, and scale economies that boosted productivity and output. Fragmentation reverses these gains, at least in part.
Early evidence of this is already emerging. In a study conducted before the U.S. imposition of tariffs, the International Monetary Fund (IMF) estimated that fragmenting the global economy into competing blocs could reduce global GDP by up to 7% in the long run, with losses concentrated in smaller, trade-dependent economies.1 The U.S. is relatively insulated from this at the macroeconomic level, simply because trade is not a large part of the overall American economy. Smaller (and especially emerging) economies that rely heavily on trade bear greater economic risk.
We now stand at an inflection point where the global economy is fracturing into regional blocs defined by geography, security alliances, and shared values. Understanding this transformation is essential for navigating the decade ahead."

Some of the figures in the nearby graph exceed 100% because they take into account exports plus imports, whereas the calculation of GDP nets the figures (exports minus imports). This gross calculation of total trade demonstrates the heightened exposure of smaller intermediary countries (Hong Kong and Singapore), the global draw of a tax haven such as Ireland, and the appeal of lower-cost manufacturing economies such as Vietnam and Mexico. The U.S. appears at the far end of the graph, with total trade accounting for only 25% of GDP. Indeed, in this study conducted by the World Bank, only Ethiopia, Sudan, and Haiti had a lower exposure to global trade than the U.S. The U.S. really is an economic island.
Or at least an economic peninsula, as no nation is completely immune from the shifting flows of trade. Even for the U.S., the reshoring and “friend-shoring” of manufacturing capacity comes with significant costs. Manufacturing labor costs in Vietnam or Mexico are three to five times lower than in China, but still 10 to 15 times lower than in the U.S. or Western Europe. Companies relocating production closer to home markets therefore may face structurally higher cost bases. Taiwan Semiconductor’s chip plant in Arizona, for instance, is estimated to cost 30% to 40% more to build and operate than comparable facilities in Taiwan or South Korea.
The duplication of research and development (R&D) efforts across regional blocs represents another growth headwind. The semiconductor industry exemplifies this inefficiency: China is reportedly investing over $150 billion in developing domestic chip capabilities to reduce dependence on Western technology, while the U.S. has committed $52 billion through the Creating Helpful Incentives to Produce Semiconductors (CHIPS) Act, and the EU has pledged €43 billion to the same ends. These parallel investments fragment R&D talent and capital that could otherwise be deployed more efficiently in a unified global market. The result is duplicative efforts, slower innovation cycles, and higher costs per unit of innovation output.
The unpredictability of trade policy is itself a constraint on investment and growth. Since the initial announcement of tariffs on Liberation Day in April 2025, tariffs have been suspended, postponed, reduced, raised, and waived – sometimes from day to day. It is impossible for companies to make long-term capital decisions on facilities and equipment in such an uncertain environment. Academic research suggests that policy uncertainty can reduce business investment by 5% to 10% in affected sectors, as companies delay capital expenditures until the regulatory environment clarifies. The proliferation of export controls, particularly on advanced technologies like artificial intelligence (AI) chips and quantum computing components, further constrains the efficient allocation of resources.
Regionalization is not, however, uniformly negative for growth. Certain economies are positioned to capture disproportionate benefits as “connector” nations within regional blocs. For example, Mexico’s nearshoring boom has been remarkable: Foreign direct investment surged to a record of $39 billion in 2024, with manufacturing investment more than doubling from 2020 levels. Vietnam has similarly benefited, with its manufacturing output growing at 8% to 10% annually as companies diversify away from China. India, with its combination of scale, democratic institutions, and alignment with Western security interests, is attracting investment in everything from iPhone assembly to pharmaceutical production.

Chart depicting annual foreign direct investment (FDI), in billions, of Mexico, Vietnam, and India from 1990 through 2024. The latest figures are $38.50 billion, $21.50 billion, and $70.00 billion, respectively, as of 2024.
Regional integration may also spur focused innovation ecosystems. The EU’s emphasis on green technology and industrial policy, backed by the €800 billion NextGenerationEU recovery fund, is creating concentrated expertise in wind energy, battery technology, and circular economy solutions. The U.S. is developing deeper capabilities in advanced semiconductors, biotechnology, and aerospace through a combination of public investment and private sector dynamism. These regional champions may generate localized productivity gains that partially offset broader efficiency losses.
The growth implications ultimately depend on how deep the fractures become and whether regional blocs maintain internal openness. If the U.S.-Mexico-Canada Agreement (USMCA; NAFTA’s successor), the EU single market, and Asian trade pacts like the Regional Comprehensive Economic Partnership (RCEP) remain vibrant, with significant internal trade and investment flows, the damage to global growth may be contained to 1% to 2% of GDP over the long term. But if fragmentation extends to financial flows, data localization, and technology standards, the costs could approach the IMF’s more pessimistic scenarios, with economic growth rates persistently 0.5 to 1.0 percentage points lower than they would have been under continued globalization.
The future of inflation
The shift from globalization to regionalization represents a fundamental regime change for inflation, one that threatens to end the “great moderation” of price pressures that characterized the 1990 to 2019 period. Disinflationary forces dominated the globalization era: Access to low-cost Chinese manufacturing, competitive labor markets spanning continents, and efficient global supply chains consistently pushed prices downward. Core inflation (excluding food and energy) in the U.S. averaged just 2.4% from 1990 through 2019, a sharp drop from an average of 6.3% in the preceding two decades. Indeed, readers with a long-enough memory will recall central bankers in some economies fretting about how to combat the threat of persistent deflation during this period.

Chart depicting the year-over-year % change in the U.S. core CPI index (ex-food and energy) from 1970 through 2025. The latest figure as of November 30, 2025, is 2.6%.
There are, of course, many drivers of inflation, of which the relative openness of economies is but one.
Regionalization threatens to reverse many of these disinflationary dynamics. The most direct inflationary impact comes from reshoring and friend-shoring production to higher-cost locations. When Apple diversifies iPhone production from China to India and Vietnam, labor costs rise substantially. Chinese manufacturing wages, while no longer the cheapest, benefit from unmatched infrastructure, supplier ecosystems, and worker productivity developed over decades. Moving production fragments these advantages. Studies of companies reshoring to the U.S. suggest manufacturing cost increases of 15% to 30%, depending on the product category and degree of automation possible. While not all of these costs pass through to consumer prices, as companies absorb some of the added burden through margin compression, the inflationary bias is clear.
Supply chain reconfiguration also sacrifices the inventory efficiencies that dampened inflation volatility. Just-in-time manufacturing systems minimized working capital and storage costs, allowing companies to operate with inventory-to-sales ratios that declined steadily from 1992 through 2007, before rising slightly from 2007 through 2019. Inventories spiked sharply in the early months of the pandemic, as supply chains were disrupted or even shut off. As the effect of the pandemic waned, inventory-to-sales ratios settled back from elevated levels, but remain higher today than they have been for most of the past 30 years.
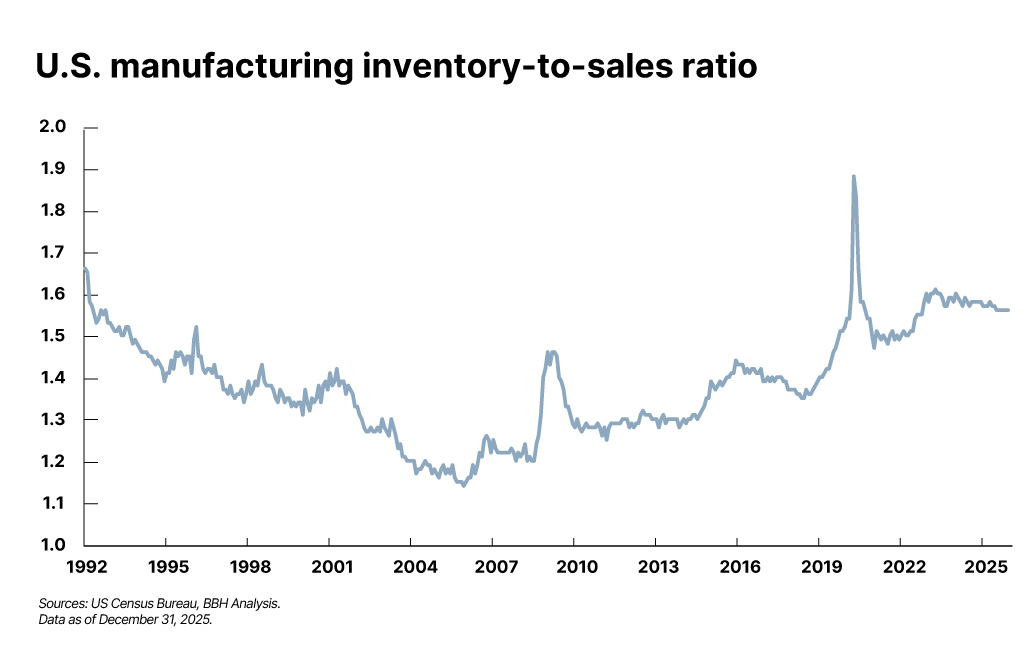
Chart depicting U.S. manufacturing inventory-to-sales ratio from 1992 through 2025. The latest figure as of December 31, 2025, is 1.56.
Fractured or regionalized supply chains prioritize resilience over efficiency, requiring companies to hold larger buffer stocks, maintain redundant supplier relationships, and accept higher carrying costs. These changes are already visible: Even accounting for the pandemic, U.S. manufacturing inventories relative to sales have increased approximately 15% since 2019, representing hundreds of billions in capital that could otherwise earn returns elsewhere. Higher capital intensity translates to higher structural costs and prices.
Energy markets illustrate these inflationary pressures particularly vividly. The global trade in liquefied natural gas created price convergence across markets, with arbitrage mechanisms limiting price divergence. In 2019, natural gas prices in the U.S., Europe, and Asia traded within a relatively narrow band, adjusting for transportation costs. But Europe’s post-2022 pivot away from Russian pipeline gas toward liquified natural gas and renewable sources fragmented the market. European natural gas prices spiked to more than 10 times U.S. prices at peaks, and while prices have moderated, structural divergences persist. Europe now pays three to four times U.S. prices, with this energy cost differential feeding through to manufacturing costs, transportation expenses, and ultimately consumer prices. Similar dynamics are emerging in critical minerals and rare earth elements, where countries are developing domestic supply chains at significant cost premiums to global market prices.
Labor market dynamics create an additional potential source of inflation. Globalization suppressed wage growth in developed economies by expanding the effective labor supply available to multinational corporations. Manufacturing workers in Detroit competed not just with peers in Tennessee but with workers in Monterrey and Shenzhen. Regionalization might tighten labor markets by reducing this competitive pressure, although there is scant evidence of this as of yet. From a peak of close to 40% of the workforce in the post-World War II years, manufacturing jobs declined in a near-straight line for decades as globalization, automation, and a shift toward an information and service economy reshaped the job market. There was a slight – almost imperceptible – uptick in manufacturing jobs in 2020 and 2021, but the downward trend resumed quickly as the pandemic disruptions faded. As of December 2025, manufacturing jobs accounted for a record low of 8% of the U.S. labor force.

Chart depicting manufacturing jobs as a percentage of the total U.S. labor force from 1940 through 2025. The latest figure as of December 31, 2025, is 8.0%.
The fiscal implications of regionalization are also inflationary as policy adjusts to a new era. Industrial policy – subsidies for domestic production, tariff revenues recycled into the economy, and infrastructure investments – represents a meaningful fiscal expansion. The combination of the U.S. Inflation Reduction Act (IRA), CHIPS Act, and infrastructure spending exceeds $2 trillion over a decade. The EU’s various green and digital transition funds total similar amounts. While spread over time, this represents sustained fiscal stimulus concentrated in specific sectors, adding demand to potentially supply-constrained markets. When governments subsidize semiconductor fabs or battery plants, they’re directing capital toward industries facing labor and equipment shortages, bidding up prices for specialized inputs.
Several countervailing forces, however, may moderate these inflationary pressures:
- Technological advancement, in particular, continues apace, with AI, machine learning, automation, and robotics potentially offsetting higher labor costs in reshored facilities. As an example, consider the disinflationary implications of something as simple as a Zoom call – less business travel, fewer hotel nights, fewer restaurant meals. Tesla’s highly automated factories in Texas and Germany demonstrate that advanced manufacturing can achieve competitive costs even in high-wage environments. The International Federation of Robotics reports industrial robot installations have accelerated significantly, with density in manufacturing approaching 150 robots per 10,000 workers globally, up from fewer than 100 in 2016. This automation can dampen the inflationary impact of geographic shifts in production.
- Competition within regional blocs may remain intense. The EU market of 450 million consumers, the USMCA zone with over 500 million, and Asia’s integrated supply chains encompassing billions of consumers still offer scale for competitive dynamics. If regionalization means trading with 25 neighboring countries rather than 150 globally, efficiency losses may be manageable. Intraregional trade in goods within these blocs often exceeds 50% of total trade, suggesting substantial existing integration to build upon.
The net effect likely represents a sustained upward, albeit modest, shift in the inflation regime, rather than runaway price growth. Central banks may find neutral real interest rates are higher in a regionalized world, with inflation settling into a 2.5% to 3.5% range in developed economies rather than the sub-2% rates that prevailed during peak globalization. This represents a measurable regime shift, but not a return to the disabling inflation of the 1970s. The key risk is that supply shocks – geopolitical disruptions, climate events, or technology failures – will generate larger price swings than in the globalized era, as diversified sourcing and arbitrage mechanisms are less available to act as economic shock absorbers and smooth disruptions.
Financial markets in a fractured world
Just as business owners and operators are readjusting to a more regionalized world, so, too, must investors take into account a shifting financial landscape. The fracturing of the global economy into regional blocs has implications for financial markets, affecting everything from equity valuations and sector performance to the structure of competition, currency dynamics, and risk premia. Investors must recalibrate their frameworks for a world where geopolitical considerations increasingly override pure financial optimization.
Investors must recalibrate their frameworks for a world where geopolitical considerations increasingly override pure financial optimization.”
Equity market implications begin with profitability. The profit margin of the S&P 500 large-cap index reached a record level of 13.5% in the latter half of 2025. As the nearby graph demonstrates, this upward trend has been in place for some time as the composition of the U.S. public equity market continues to shift toward higher-margin technology and information services sectors. Globalization contributes to this technology success story, offering companies access to low-cost inputs, efficient supply chains, and the ability to minimize tax obligations through cross-border structures. Regionalization threatens to pressure these margins. Companies facing higher production costs, increased inventory requirements, and duplicative infrastructure investments will struggle to maintain current profitability without offsetting productivity gains or pricing power (see the previous discussion of inflation).

Chart depicting the S&P 500’s operating margin from 2001 through 2025. The latest figure as of December 31, 2025, is 13.48%.
Profit margins are clearly cyclical. The damage wrought to profitability by the GFC and the pandemic are evident in the sharp downward spikes in the graph. And yet following an economic dislocation, margins tend to revert rather quickly to a mean, a testament to the remarkable resilience of this economy and market. Margins at present are about 150 basis points (bps)2 higher than the trendline, implying that a reversion to a (still-impressive) mean would take profits down about 10% to 15% from current levels. With the S&P 500 already priced at 22.5 times consensus expectations for 2026, there isn’t much valuation room for a downgrade to earnings expectations.
It is, however, increasingly difficult to talk about or even analyze “the market” as if it is a single thing. The concentration of large-cap technology companies skews any calculation of average return, profitability, margins, or valuation. Sector performance will diverge even more dramatically in a more regionalized world. Traditional winners from globalization – technology companies with distributed supply chains, consumer goods manufacturers relying on low-cost production, and multinational conglomerates optimized for global efficiency – face increasing headwinds. Conversely, several sectors emerge as potential beneficiaries. Defense contractors are benefiting from sustained budget increases as countries prioritize military capabilities, with global defense spending rising toward $2.5 trillion annually. Infrastructure and construction companies benefit from the massive investments in regionalized production capacity. Energy companies, particularly those in regions with cost advantages like U.S. natural gas producers, enjoy structurally favorable pricing power in fragmented markets. Logistics and supply chain companies that can navigate complexity and manage regional distribution networks become increasingly valuable.
The technology sector presents a more complex picture. While disrupted supply chains and export restrictions challenge hardware manufacturers, the software and services segments may prove more resilient. Cloud computing, cybersecurity, and AI platforms can serve regional markets without the same degree of physical friction. Indeed, the proliferation of regional data centers and digital infrastructure spending may even benefit these segments. However, the fragmentation of technology standards – China’s developing parallel ecosystems in everything from telecommunications (5G) to payment systems – will constrain addressable markets and create stranded investments in incompatible technologies.
Small- and mid-cap stocks may be better positioned in a regionalized paradigm. Historically, smaller companies with domestic focus have been less sensitive to global trade dynamics and currency fluctuations. The Russell 2000 index, heavy with domestic-oriented businesses, may enjoy a sustained rerating relative to the multinational-heavy S&P 500. Similarly, international diversification strategies require reconsideration. The traditional argument for international equity exposure is that global diversification reduces risk while broadening an investor’s opportunity set. But if regional blocs move more independently, with divergent monetary policies, fiscal approaches, and regulatory frameworks, the correlation benefits change. Some diversification benefits may actually increase if regional economies decouple, while geopolitical risk premiums rise. The correlations and linkages of the last 30 years need to be reconsidered.
Fixed income markets face their own adjustments. Higher structural inflation implies higher long-term bond yields, and investors demand compensation for the erosion of purchasing power. The 30-year U.S. Treasury yield averaged roughly 2.5% from 2015 through 2020, reflecting low inflation expectations and substantial foreign demand for Treasuries, particularly from China and Japan. In a regionalized world with inflation settling above 3%, these yields likely need to trade 3.5% to 4.5% or higher to offer positive real returns – and indeed, the market already seems to be pricing this in. This represents a fundamental regime change for bond investors after a four-decade bull market in fixed income.
Foreign central bank appetite for U.S. Treasuries may also moderate as countries prioritize domestic financial market development and reduce dollar dependency – though the dollar’s reserve currency status provides considerable inertia. Although it has lost some ground over the past decade, the dollar remains the global reserve currency, accounting for 57% of all central bank foreign exchange reserves in the world. The euro remains a distant second, with a 20% share. Despite China’s looming presence on the global economic stage, the renminbi is a mere 2% of global reserves. The dollar stands tall for now, but regionalization would likely reduce demand for dollars, with implications for interest rates and currency values alike.

Chart depicting the composition of global foreign exchange reserves between the dollar (USD), euro (EUR), pound (GBP), renminbi (RMB), and others from 1995 through 2025. The latest figures as of June 30, 2025, are 57%, 20%, 5%, 2%, and 16%, respectively.
Emerging markets require particular discernment in a regionalized framework. Not all emerging economies will fare equally. Those positioned as connectors within regional blocs – Mexico in North America, Poland in Europe, Vietnam and India in Asia – may enjoy sustained economic growth, along with the corporate profitability and equity market appreciation that follow over time. Countries caught between competing blocs or lacking clear alignment face greater challenges. Portfolio allocation in this new world should increasingly focus on regional trade patterns, infrastructure connectivity, and alignment with major economic blocs, rather than traditional emerging market beta.
Portfolio allocation in this new world should increasingly focus on regional trade patterns, infrastructure connectivity, and alignment with major economic blocs, rather than traditional emerging market beta.”
Risk premiums across asset classes likely need to rise to reflect greater geopolitical uncertainty. The equity risk premium – the expected return on stocks above safe bonds – compressed during the globalization era as geopolitical risk, or at least the perception thereof, diminished. A return to higher risk premiums would imply lower valuation multiples for equities and wider credit spreads in corporate bonds. The practical implication is that investors should adjust expected returns for traditional asset classes downward and reconsider their needs for liquidity in an environment of heightened volatility.
Finally, alternative investments and private markets may gain appeal in a regionalized world. Private equity and venture capital can be deployed with regional focus, supporting the buildout of localized production ecosystems. Real assets – infrastructure, commodities, real estate – offer inflation protection and tangible value in an environment of greater price volatility. Commodities, in particular, may experience a sustained bull market as regionalization drives duplicative demand for critical minerals, energy resources, and agricultural commodities previously traded in globally integrated markets. Gold and other traditional safe havens may also benefit as hedges against geopolitical risk and currency uncertainty.
Beyond economics and markets
It remains to be seen if this pivot toward regionalization is truly a paradigm shift or merely a transitory reflection of the perfect storm of a global pandemic, the Russian invasion of Ukraine, and a neo-mercantilist U.S. trade policy. While the economic impacts of regionalization on growth, inflation, and financial markets are already becoming evident, the transformation, if sustained, extends into dimensions that fundamentally alter how investors must evaluate opportunities and risks. Portfolio managers need to pay particular attention to three areas: corporate strategy disruption, emerging market differentiation, and the challenge of navigating transition risks.
The era of the truly global corporation optimized for worldwide efficiency is drawing to a close, or at least shifting to a new state in which geography matters more than it has for the past generation. For decades, multinational companies built integrated supply chains spanning continents, consolidated back-office functions in lowest-cost locations, and managed global operations from centralized headquarters. This model is breaking down. Companies now face pressure to maintain parallel operations across regional blocs, duplicating functions that were previously consolidated. A semiconductor company might need separate design teams for U.S. and Chinese markets due to export restrictions. A software firm must build redundant data centers to comply with data localization requirements in Europe, Asia, and North America. An automotive manufacturer possibly needs separate supply chains for USMCA, EU, and Asian production rather than sourcing globally optimal components.
This fragmentation imposes real costs but also creates winners and losers among corporate strategies. Regional champions – companies with deep expertise and dominant positions within a specific geographic bloc – may outperform traditional multinationals struggling to manage complexity across competing regions. European industrial companies focused on serving the EU market with minimal extra-regional exposure avoid the costs of navigating U.S.-China tensions. American defense contractors benefit from allied nations’ increased military spending without needing to compete in Chinese markets. Conversely, companies whose business models depend on global scale – think cloud computing platforms requiring worldwide server networks or pharmaceutical companies amortizing R&D costs across global markets – face strategic challenges. Yesterday’s competitive advantage may be tomorrow’s competitive disadvantage as addressable markets shrink and regulatory requirements diverge.
For investors, this suggests careful analysis of corporate geographic exposure and strategic positioning. Companies with balanced regional portfolios may appear diversified but actually face maximum complexity costs. Firms concentrated in growing regions with clear competitive advantages may prove more attractive. Stranded assets become a real concern: Manufacturing facilities, distribution networks, and technology investments in the "wrong” geographic locations lose value as trade barriers rise and regional preferences shift. The traditional investment approach of favoring global multinationals for their diversification may need recalibration toward companies with focused regional strategies or those genuinely capable of managing multiregional complexity profitably.
Emerging markets require even greater discernment in a regionalized world, as these economies will experience vastly different trajectories based on their positioning within or between major economic blocs. The traditional approach of treating emerging markets as a homogeneous asset class – bundling countries from Brazil to Thailand into a single portfolio allocation – becomes increasingly obsolete. Instead, investors must differentiate between three categories of emerging economies, each with distinct risk-return profiles:
- A first category consists of “connector countries” strategically positioned within major regional blocs. Mexico, as the prime beneficiary of North American nearshoring, has seen manufacturing investment surge as companies relocate production closer to U.S. markets. Vietnam occupies a similar position within Asian supply chains, and India, with its combination of scale, democratic institutions, and strategic alignment with Western interests, is positioning itself as a manufacturing alternative to China in sectors from smartphones to pharmaceuticals. Poland serves this role within the EU, attracting investment as companies establish European production footprint. These connector countries benefit from sustained capital inflows, technology transfer, and employment growth, making them attractive markets for foreign direct investment (FDI) despite near-term volatility.
- A second category comprises countries caught between competing blocs or lacking clear alignment. Many African nations, Central Asian republics, and some Southeast Asian economies face pressure to choose between Chinese Belt and Road infrastructure financing and Western-led development models. These countries may struggle to attract sustained FDI as companies hesitate to commit capital in locations where geopolitical winds could shift. Their debt sustainability comes under pressure as access to diversified international funding becomes more difficult. Turkey exemplifies the challenges: Positioned between Europe, Russia, and the Middle East, the country faces currency volatility and capital flight as investors price in geopolitical uncertainty. For portfolio managers, these markets require higher risk premiums and shorter time horizons, with careful monitoring of political developments that could shift regional alignments.
- A third category includes countries firmly aligned with blocs but lacking the infrastructure, institutions, or strategic positioning to become major manufacturing hubs. These economies may still grow through commodity exports, domestic consumption, or services, but they won't capture the same manufacturing investment flows as connector countries. Their equity markets may offer opportunities, but investors should temper expectations about the pace of development and recognize that regionalization provides less of a tailwind than for strategically positioned peers.
Finally, investors must navigate the profound challenge of transition risks – the reality that the shift from globalized to regionalized economic order may prove more turbulent and costly than the destination itself. The timing and pace of fragmentation remain deeply uncertain.
A gradual transition, playing out over 10 to 15 years, allows companies and economies to adjust incrementally. Supply chains relocate methodically, with old facilities depreciated before new ones are built. Workers retrain as manufacturing patterns shift. This scenario, while still costly, spreads adjustment burdens over time and allows capital to be reallocated efficiently. Investors can position portfolios gradually, rotating toward sectors and geographies benefiting from regionalization while reducing exposure to those facing headwinds.
An abrupt transition, triggered by geopolitical crisis, sudden policy shifts, or cascading supply chain failures, imposes far higher costs. Companies scramble to relocate production, accepting suboptimal locations and paying premium prices for construction and equipment. Critical shortages emerge in products whose supply chains cannot adjust quickly. Financial markets experience sharp dislocations as investors reprice assets. The 2020 to 2022 period offered a preview: Pandemic-related supply shocks, followed by the Ukraine conflict’s energy disruptions, demonstrated how quickly integrated systems can fracture and how painful rapid adjustment proves.
Path dependency complicates these scenarios. Decisions made today – where to build factories, which markets to prioritize, which regional alliances to cultivate – lock in structures that persist for decades. A semiconductor fabrication plant takes three to four years and $10 billion to $20 billion to build. Once constructed, it operates for 15 to 20 years, making the location decision essentially irreversible. Trade agreements, once established, create constituencies that resist change even if economic conditions shift. Infrastructure investments connect specific regions and make alternative routing costly. Investors must therefore consider not just current positioning, but also the durability of regional structures being built today.
Moreover, the risk of overshooting looms. Just as globalization may have extended too far – creating brittle supply chains prioritizing efficiency over all else – regionalization could go too far in the opposite direction. Excessive fragmentation that duplicates capacity, fragments research efforts, and erodes remaining scale economies would impose costs exceeding any security or resilience benefits. History suggests that policy pendulums often swing past optimal points before correcting. The challenge for investors is identifying when regionalization moves from rational adjustment to counterproductive extreme, and positioning accordingly. This likely means maintaining some exposure to truly global businesses and being prepared to increase that exposure if fragmentation clearly overshoots.
The challenge for investors is identifying when regionalization moves from rational adjustment to counterproductive extreme, and positioning accordingly.”
The transition also creates potential for policy reversal. A change in political leadership in major economies could rapidly shift trajectories. Climate change imperatives might force renewed global cooperation on clean energy technology, creating islands of integration within otherwise fragmented systems. Breakthrough technologies – like transformative AI capabilities, fusion energy, and quantum computing – could transcend geographic boundaries and restore elements of global integration. The probability of such reversals is impossible to quantify, but their potential impact on portfolios is substantial.
Contact Us


1 Bolhuis, Marijn A., Jiaqian Chen and Benjamin Kett. The Costs of Geoeconomic Fragmentation, International Monetary Fund, June 2023.
2 One basis point is equal to 1/100th of 1%, or 0.01%.
Opinions, forecasts, and discussions about investment strategies are as of the date of this commentary and are subject to change. References to specific securities, asset classes, and financial markets are for illustrative purposes and are not intended to be and should not be interpreted as recommendations
Brown Brothers Harriman & Co. (“BBH”) may be used to reference the company as a whole and/or its various subsidiaries generally. This material and any products or services may be issued or provided in multiple jurisdictions by duly authorized and regulated subsidiaries. This material is for general information and reference purposes only and does not constitute legal, tax or investment advice and is not intended as an offer to sell, or a solicitation to buy securities, services or investment products. Any reference to tax matters is not intended to be used, and may not be used, for purposes of avoiding penalties under the U.S. Internal Revenue Code, or other applicable tax regimes, or for promotion, marketing or recommendation to third parties. All information has been obtained from sources believed to be reliable, but accuracy is not guaranteed, and reliance should not be placed on the information presented. This material may not be reproduced, copied or transmitted, or any of the content disclosed to third parties, without the permission of BBH. All trademarks and service marks included are the property of BBH or their respective owners. © Brown Brothers Harriman & Co. 2026. All rights reserved. PB-09225-2026-01-09