


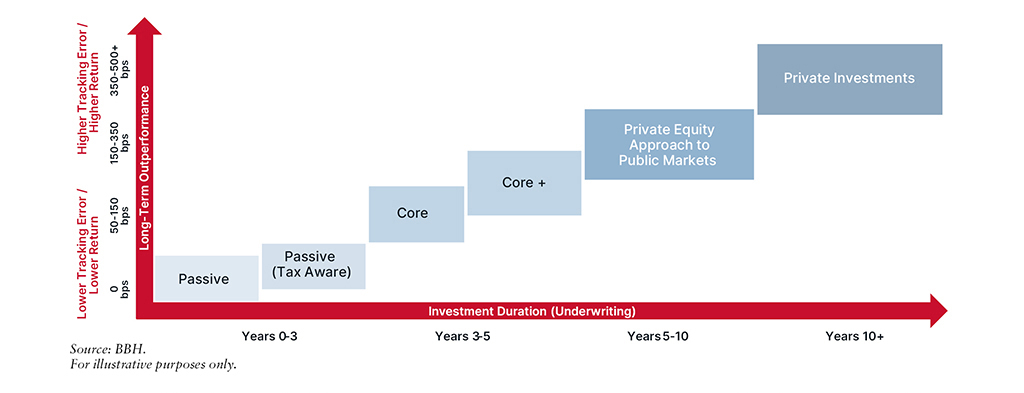
Chart depicting investment strategies on a scale of increasing investment duration (x-axis; from years 0-3 to years 10+) and long-term outperformance (y-axis; from lower tracking error/lower return to higher tracking error/higher return). In ascending order, the strategies are Passive, Passive (tax-aware), Core, Core+, Private Equity Approach to Public Markets, and Private Investments.
2025 was an eventful year, from policy shifts and geopolitical tensions to rapid artificial intelligence (AI) innovation and growth in the private credit universe. We recently sat down with Chief Investment Officer (CIO) Justin Reed and Deputy CIO Ilene Spitzer to explore how these forces and more will shape the investment landscape as we enter 2026.
What drove markets in 2025, and what do you see as key risks today?
Justin Reed: After advancing 26.3% in 2023 and 25% in 2024, the S&P 500 rose 17.9% in 2025, largely driven by a combination of macro and company-specific (micro) factors. On the macro side, after keeping the fed funds rate steady during the first half of 2025, the Federal Reserve (Fed) restarted its interest rate-cutting cycle with three rate cuts for a total of 75 basis points (bps).1 This shift toward a more dovish monetary policy provided a supportive backdrop for business growth and investment, helping to boost equities – particularly as declining interest rates fueled the rally in the S&P 500. As such, the prospect of lower borrowing costs (the 30-day average Secured Overnight Financing Rate [SOFR] rate has declined by 74 bps to 3.8%, the lowest since December 2022) has helped boost future earnings per share (EPS) growth estimates and provided support to high valuations given the inverse relationship between interest rates and valuation multiples.
In terms of business growth, despite concerns that tariffs could cause a recession, quite the opposite occurred as consumer spending remained resilient and capital expenditures (capex) related to AI boosted growth. The initial reading by the Bureau of Economic Analysis (BEA) estimated real U.S. gross domestic product (GDP) growth reached 4.3% on an annualized basis in third quarter 2025, marking the highest growth rate in over two years and an acceleration from the 3.8% real GDP growth generated in second quarter 2025.
Digging more into the micro, despite downward earnings revisions during the first half of the year and heightened growth slowdown concerns due to tariffs, company fundamentals ultimately surprised to the upside. The S&P 500 is now estimated to generate earnings growth of 11.5% in 2025, up from 8.7% estimated in June 2025, and 14.9% in 2026. This is largely driven by the sharp increase in hyperscaler capital spending and multibillion-dollar agreements signed between key AI developers and semiconductor manufacturers, which disproportionately benefited the Magnificent Seven (Mag 7)2 within large-cap equities and speculative growth stocks within small-cap equities.
Approximately 42% of the S&P 500's 17.9% return can be attributed to the performance of the Mag 7, reflecting the ongoing trend of heightened market return concentration observed in recent years. As such, the communication services and technology sectors were the best performing sectors in the S&P 500, returning 33.4% and 24% in 2025, respectively.
Moving onto risks, U.S. large-cap equities are expensive across a series of valuation measures. Whether you look at price to earnings (P/E), dividend yield, or price to cash flow, the S&P 500 trades at least in the top quintile of historical valuations going back 30 years. With a forward P/E ratio of 22x as of December 31 , 2025, the S&P 500 sits just under two standard deviations above its 30-year historical average of 16.8x.
The market rally that began on April 9, 2025, following the policy pivot by the Trump administration, was driven in large part by AI exuberance. For example, Nvidia saw its share price double from its April lows and became the world’s first $5 trillion company. The period also saw a remarkable rotation into speculative growth and highly shorted companies following the first quarter. This was a year in which high-quality companies, not only across U.S. equities but international equities as well, did not keep up with lower-quality companies on a price basis.
This was a year in which high-quality companies, not only across U.S. equities but international equities as well, did not keep up with lower-quality companies on a price basis.”
Ilene Spitzer: Following up on that, one of the risks that we are monitoring closely is the historic level of concentration within the S&P 500. Historically, the S&P 500 is considered concentrated when the top 10 stocks reach 23.4% of the index; today, that number is 40.7% . In other words, 2% of the names in the benchmark represent 40.7% of the overall exposure, while the Mag 7 represents 34.9%. To us, the outlook for the S&P 500 is strongly tied to the outlook for the AI giants. Our equity portfolio is less concentrated in the top 10 names and more attractive from a forward fundamental standpoint compared with the S&P 500. We have constructed client portfolios that are more diversified than the benchmark – owning businesses across geographies, sectors, and the market cap spectrum. In 2025, we generated alpha by owning international stocks, for example. International equities benefited from a declining U.S. dollar and from phenomenal returns for defense-related companies on an expected increase in defense spending by NATO countries.
It is important to note that following periods of market concentration in the top 10 index constituents, the other 490 stocks outperformed the top 10 91% of the time over the following five-year period. This could have positive implications for our portfolio and for active management in general.
Coming back to other risks, we continue to monitor the impact of tariffs on equity markets. In 2024, the average tariff rate on goods imported to the U.S. was 2.4%. Today, the Yale Budget Lab estimates that the effective tariff rate on U.S. imports is about 17%, the highest rate since the 1930s.3 So far, inflation data has remained muted, although November and December numbers were skewed by the federal government shutdown.
There’s been much discussion about the K-shaped economy and divergence in economic realities between top earners and lower earners. We’re closely watching consumer sentiment and spending as well as inventory rebuild by businesses, which tariffs may affect more going forward.
We are also closely monitoring the risk of stagflation. We are increasingly concerned that lower interest rates and continuing trade tensions may lead to higher inflation in the near term. We are also on the lookout for slowing growth, in part due to consumer spending headwinds, particularly for low- and middle-income earners. When combined, these market dynamics suggest a risk of stagflation, which could create monetary policy challenges for the Fed.
What is your outlook on AI?
JR: At a very high level, we are cautiously optimistic about AI. There is a principle called Amara’s Law that suggests people tend to overestimate the short-term impact of technological innovation and underestimate its long-term impact. We think this principle is applicable to what we’re witnessing today, and as a result, we view AI as both an opportunity and a risk within client portfolios.
One of the key risks we are monitoring relates to the level of capex of the hyperscalers – think companies like Alphabet and Meta that are spending heavily on data centers in support of AI initiatives. This year, we expect the hyperscalers to spend roughly $400 billion in capex. Notably, there are limited revenues associated with those expenditures today. In isolation, that is concerning. Many will remember large capex in the lead-up to the tech bubble. The source of that capex is important, though. In the tech bubble, many of the companies that had large capex spend were funding that from debt. Today, most of the hyperscalers are funding their spending from cash flow. We think that helps to mitigate some of the capex spending risk.
We study history to inform our positioning, and we have done the same with AI. While no two innovation cycles are the same, we do believe that there are lessons to be learned from the past.
Thinking about the internet in the lead-up to, during, and after the tech bubble, there were three key layers:
- Infrastructure (companies like Cisco and Intel)
- Platform (companies like Alphabet and Microsoft)
- Application (companies like Meta and Netflix)
In the current AI innovation cycle, the infrastructure layer is composed of companies like Nvidia, Taiwan Semiconductor Manufacturing, and ASML. The platform layer is more nascent, including companies like OpenAI, Anthropic, Alphabet, and Meta. The application layer is nascent, but currently includes companies like Cursor, an AI-powered code editor, or Harvey, an AI application for the legal services industry. We have exposure to these types of companies through our venture capital (VC) program.
Over the long term, our view is that we are likely to witness something similar to the internet innovation cycle where the platform and application layers experience the strongest returns. There were success stories in the infrastructure layer (companies like Cisco), but there was an overbuilding cycle that led to less-attractive returns in aggregate relative to the companies built upon that infrastructure.
We are careful not to overload our AI exposures now, as most of the companies available for investment are in the infrastructure layer and, to a lesser extent, the platform layer. We think our clients benefit from focusing on those opportunities where we gain AI optionality, leaving some dry powder to “dollar-cost average” into future AI opportunities in the coming years.
So, what does this mean for portfolio positioning?
IS: In client portfolios, we are slightly underweight indices in the AI infrastructure and platform layer within public equities. That said, we are focused on sizing up our AI platform and AI application layer exposures over the next few years, across both public and private equities. For clients who can invest in the asset class, we think VC exposure will facilitate meaningful long-term optionality to AI.
We also evaluate our AI exposure by assessing how our underlying portfolio companies are harnessing AI to become more efficient and productive. Some of them are even moving into using AI to grow revenues instead of just enhancing margins. As with any technological innovation, there will be winners and losers. We want to invest in those companies that can harness the technology and stay away from those companies that are unwilling or unable to incorporate it successfully.
We are focused on gaining additional exposure through what we call AI derivatives. We are doing a lot of work on power needs, which we consider to be one of the biggest gaps in the value chain. We recently onboarded a public equity strategy whose largest position is a collection of several utility companies that are benefiting from increased power demand.
As with any technological innovation, there will be winners and losers. We want to invest in those companies that can harness the technology and stay away from those companies that are unwilling or unable to incorporate it successfully.”
What is your view on passive investment options?
JR: We view passive investment options as just one of several tools we can use to help our clients meet their goals and objectives. The appropriateness of an investment for a given client depends on many factors, including tax sensitivity, time horizon, and tolerance for deviations from benchmark performance, often referred to as “tracking error.” For the most benchmark-aware clients with a shorter time horizon, passive investment options can help them stay invested over the long term. For our taxable clients, we encourage the use of our proprietary tax-managed equity strategy, which provides additional tax optimization benefits compared with investing in a passive exchange-traded fund (ETF) that tracks an index.
Beyond passive, we have active management options that differ in a number of dimensions. Our Core and Core+ strategies include investment managers who look to outperform over three to seven years, and our alpha managers, who take a private equity (PE) approach to public markets, tend to underwrite to a holding period of seven to 15 years and are more absolute return-focused. Over any short time period, alpha manager returns are likely to differ meaningfully from indices – both underperformance and outperformance can be significant (i.e., up or down 20%) in a single year.
Investing is about time in the markets, not timing the markets. That is why it is critical that we guide our clients toward investment solutions that best meet their risk tolerance, tracking error expectations, and return objectives. Keeping clients invested is our goal.

| "Stock owner" mindset | "Business owner" mindset | |||||
| Client’s Goal | Liquidity | Liquidity | Conservative Growth | Conservative Growth | Growth | Accelerated Growth |
| Implementation | Passive | Passive (Tax Aware) | Core | Core + | Private Equity Approach To Public Markets | Private Investments (Private Equity & Venture Capital) |
| Return Focus | Index | Index | Relative | Relative/Absolute | Absolute | Absolute |
| Tracking Error | -- | Low | Low-Medium | Medium | High | Very High (all privates) |
| Active Share | -- | Low | Low-Medium | Medium | High | Very High (all privates) |
| Alpha Potential | -- | Low | Low-Medium | Medium | High | Very High |
| Tax Efficiency | High | Very High | Medium | Medium | High | Very High |
| Model Options | No | Yes | Yes | Yes | No | No |
| Investment Duration | n/a | n/a | 1-3 Years | 3-5 Years | 5-10 Years | 10+ Years |
Passive investment offerings also warrant investment diligence. There are now more ETFs than stocks, and investment selection is still key. Our team spends a lot of time curating the best passive options, focusing on variables such as fees, construction, liquidity, and tracking error, among other variables.
Finally, we would be remiss if we did not say that clients should be careful about giving up on active management in today’s environment. With historic levels of market concentration and the S&P 500 trading close to all-time highs and valuations, we think active management will help to preserve capital over the medium term.
Investing is about time in the markets, not timing the markets. That is why it is critical that we guide our clients toward investment solutions that best meet their risk tolerance, tracking error expectations, and return objectives.”
Private credit, and direct lending in particular, has received increasing attention in the press. How are you thinking about private credit today?
IS: Let’s start off with a reminder about what private credit is – borrowing that occurs outside of the traditional banking system, creating securities that are not traded in public markets. Direct lending, a common form of private credit, refers to privately negotiated loans between a borrower and a nonbank lender. Since the global financial crisis (GFC) in 2008, the private credit universe has seen exponential growth, as changing capital requirements for banks created a void that financial firms stepped in to fill.
Investors are attracted to private credit as a source of income, portfolio diversification, and the ability to receive a yield premium over more traditional fixed income markets. Like most opportunities, as the number of players in the space has increased, we’ve seen spreads compress, particularly in the most plain area of the market: PE-sponsored direct lending.
More recently, negative headlines have surfaced around the implosion of First Brands and Tricolor. Both companies had utilized private credit markets as a source of capital. The story of First Brands highlights the importance of thorough due diligence. Many private credit firms turned First Brands away, citing a number of signs they viewed as suspicious, including:
- The company’s willingness to raise such expensive debt despite reporting high cash balances
- A lack of clarity around why the company needed a $200 million loan given high cash balances
- The company’s consistently late payments to its suppliers
- The company’s headquarters being only a single floor of a Cleveland office building – unusual for a $5 billion revenue company
- The existence of numerous lawsuits against the founder, including allegations of fraud by several lenders
Given the tremendous growth in private credit and less attractive opportunity set (which in our opinion leads some managers to lend to less attractive companies), we have been cautious about adding strategies in traditional direct lending. Instead, we have focused on less frothy parts of the private credit universe, including real estate lending and alternative credit.
Taking a step back, whether it is public equity, PE, traditional fixed income, or private credit, we look to partner with managers that know what they own and why they own it. While underwriting mistakes happen, thorough vetting of investment opportunities can go a long way in avoiding fraudulent situations and preserving capital. We have been opportunistic in our private credit offering, only partnering with established groups with strong histories of strict underwriting standards.
Final question: Any key themes for your outlook for 2026 and beyond?
JR: Let’s start with a geographical lens: We are neutral on U.S. equities, meaning that we are encouraging our clients to stay close to strategic targets and to rebalance if they are overweight after several strong years of relative performance, excluding 2025.
One of the things we are keeping a close eye on in the U.S. is the so-called K-shaped economy, which suggests that higher-income earners and select companies will do well, while lower-income earners and broader sectors will lag. The top 10% of households, as measured by income, account for roughly 60% of all consumer spending. Those same households control almost 85% of U.S. wealth.
The divergence of the K-shaped economy is illustrated in the nearby chart, which compares the S&P 500 – typically benefiting higher-income individuals – to consumer confidence, a measure that more broadly represents sentiment among lower-income consumers. It suggests a story of diverging fortunes, which bears monitoring over the next year and beyond.

Chart depicting the S&P 500 (left-hand side) vs. Consumer Confidence Index (right-hand side) from 2022 through 2025 diverging to form a “K-shaped” economy. The latest figures as of December 31, 2025, are 6845.5 and 52.90, respectively.
Can the top 10% of the socioeconomic spectrum continue to support nearly half of all spending?4 We are monitoring the health of the upper-income consumer closely. If the stock market suffers declines, and the wealth effect diminishes, the U.S. economy is left vulnerable.
We continue to be very constructive on international equities, specifically in Europe and emerging markets. This positioning benefited client portfolios in 2025, and we expect it has the potential to continue in the year ahead. While U.S. equities, as measured by the S&P 500, are trading close to all-time high valuations, international and emerging markets are trading just slightly above their long-term average valuations.
For our U.S. clients, we also highlight the geopolitical environment, where all signs point to President Trump nominating a dovish Fed chair in 2026 who will be focused on lowering rates. We think this likely leads to additional U.S. dollar depreciation, especially when the dollar is trading at a 37% premium to the euro and 40% premium to the Japanese yen, based on purchasing power parity (PPP). Within Europe, we continue to have meaningful exposure to defense companies, which also benefited client portfolios in 2025. We expect the trend of renationalization and decoupling from a reliance on the U.S. for defense to continue.
For clients with an overweight to equity vs. fixed income, we recommend rebalancing back to the appropriate asset class allocation. A client who invested in a traditional 60/40 equity/fixed income portfolio in 2019 and did not rebalance would now have an 80/20 portfolio due to the run-up in stock prices and muted returns in fixed income since then. We encourage clients to rebalance soon if they have not done so already.
IS: Coming back to equity market valuations, we are particularly constructive on independent return strategies. These are strategies that tend to generate equity-like returns with low correlation to broader equity and fixed income markets. We have added several of these strategies over the past couple of years and are focused on adding more to the platform this year. We think that the addition of these strategies to client portfolios will help preserve capital in any equity market correction while still providing growth potential.
Turning to AI, we are cautiously optimistic about mega-cap tech. As we mentioned, the hyperscalers have largely funded capex through cash flow instead of debt. Our analysis of these companies leads us to believe that most of the recent price appreciation is a result of fundamental growth (e.g., revenue and EPS growth) and strong balance sheets, instead of multiple expansion.
We are being thoughtful about playing AI derivatives. There is some correlation to the AI trade that has us thinking more deeply about portfolio construction and preservation of capital. As we mentioned earlier, in the long term we are very constructive on AI, but if we do experience a meaningful disappointment on the AI front in the next year or so, that may translate into more areas than many investors realize.
For example, many investors have diversified into energy power via utilities and real estate, which have historically delivered portfolio diversification. Now imagine a world in which AI use cases and revenue fail to materialize as expected – what happens to power demand, and what happens to the value of all those data centers? What happens to all the office real estate owned by hyperscalers?
Switching to monetary policy, the fed funds futures curve is pricing in two rate cuts in 2026, while the Fed is projecting just one cut. We think this mismatch in rate cut expectations can be a source of equity market volatility in 2026, given the impact of rates on valuation multiples. Despite this mismatch, the common denominator is at least one rate cut. As a result, we expect short-duration rates to be lower in 2026 and for the yield curve to steepen further. This should be a tailwind to longer-duration, rate-sensitive assets like PE, real assets, U.S. large-cap companies (mainly growth companies), and smaller-cap companies (mainly pro-cyclicals and consumer-focused companies). We continue to encourage clients to extend to defend: We believe locking in higher rates now will benefit results in the coming years, as reinvestment risk is a greater concern than interest rate risk at this point in the cycle.
We continue to encourage clients to extend to defend: We believe locking in higher rates now will benefit results in the coming years, as reinvestment risk is a greater concern than interest rate risk at this point in the cycle.”
In 2025, mergers and acquisitions (M&A) meaningfully increased (compared to 2024), and we also witnessed a strong IPO market. We expect this environment to continue, particularly in a lower interest rate environment. In such an environment, we would expect more distributions from PE and VC firms, as well as an interesting environment for event-driven independent return strategies. Accordingly, we continue to be constructive on PE (and VC) focused on return generation through value-add initiatives and proprietary deal sourcing (as opposed to leverage).
At the end of the day, we are always trying to look around corners to take advantage of opportunities and mitigate risk in client portfolios. We will continue to do this in 2026 and beyond.
Justin and Ilene, thank you for your time.
To learn more about our Investment Research Group’s positioning, reach out to your BBH relationship manager.
Contact Us


1 One basis point is equal to 1/100th of 1%, or 0.01%.
2 Magnificent Seven (Mag 7): Apple, Microsoft, Alphabet (Google), Amazon, Nvidia, Meta, and Tesla.
3 Source: The Budget Lab as of November 17, 2025.
4Source: Moody’s Analytics.
Past performance does not guarantee future results.
Opinions, forecasts, and discussions about investment strategies are as of the date of this commentary and are subject to change without notice. References to specific securities, asset classes, and financial markets are for illustrative purposes only and are not intended to be and should not be interpreted as recommendations.
Diversification does not eliminate the risk of experiencing investment losses.
Investment Advisory Products and Services:
NOT FDIC INSURED NO BANK GUARANTEE MAY LOSE VALUE
Brown Brothers Harriman & Co. (“BBH”) may be used to reference the company as a whole and/or its various subsidiaries generally. This material and any products or services may be issued or provided in multiple jurisdictions by duly authorized and regulated subsidiaries. This material is for general information and reference purposes only and does not constitute legal, tax or investment advice and is not intended as an offer to sell, or a solicitation to buy securities, services or investment products. Any reference to tax matters is not intended to be used, and may not be used, for purposes of avoiding penalties under the U.S. Internal Revenue Code, or other applicable tax regimes, or for promotion, marketing or recommendation to third parties. All information has been obtained from sources believed to be reliable, but accuracy is not guaranteed, and reliance should not be placed on the information presented. This material may not be reproduced, copied or transmitted, or any of the content disclosed to third parties, without the permission of BBH. All trademarks and service marks included are the property of BBH or their respective owners. © Brown Brothers Harriman & Co. 2026. All rights reserved. PB-09225-2026-01-09