

In each issue of Owner to Owner, we review aspects of the business environment on three fronts:
- Overall economy
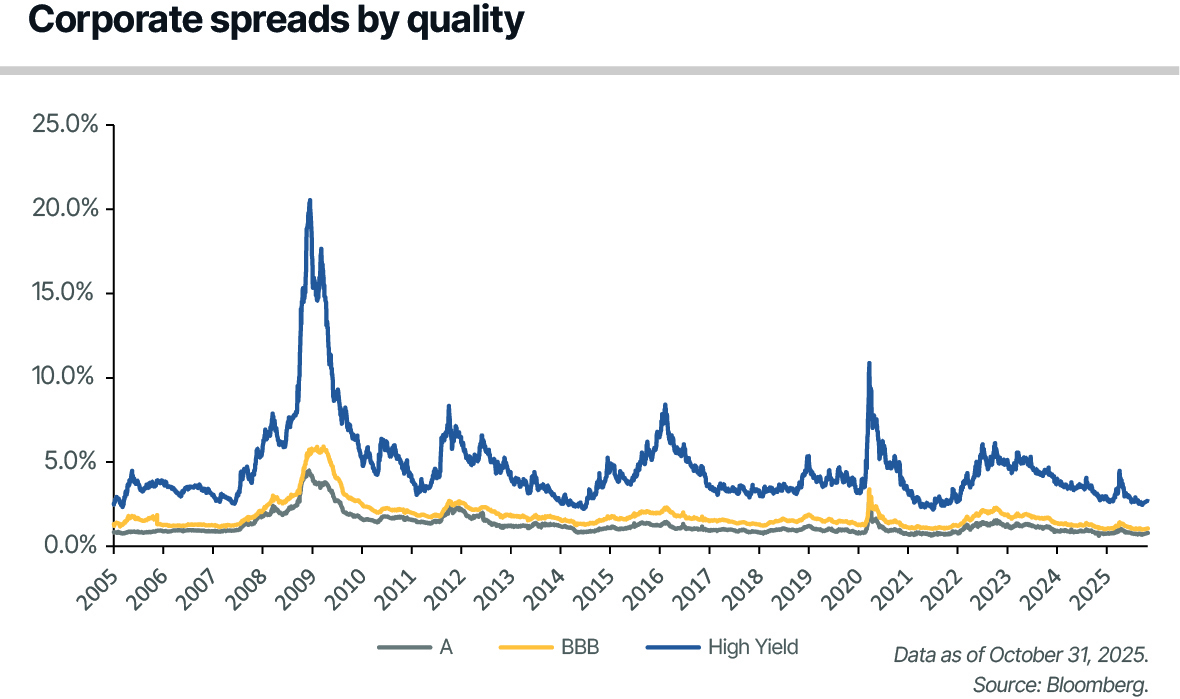
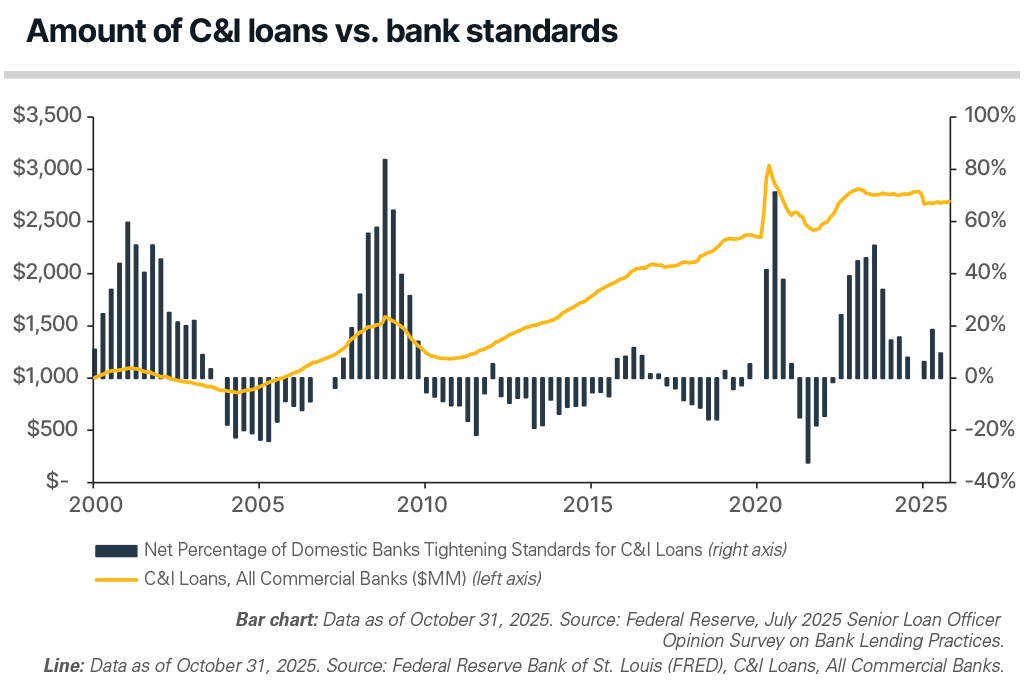
- Credit markets
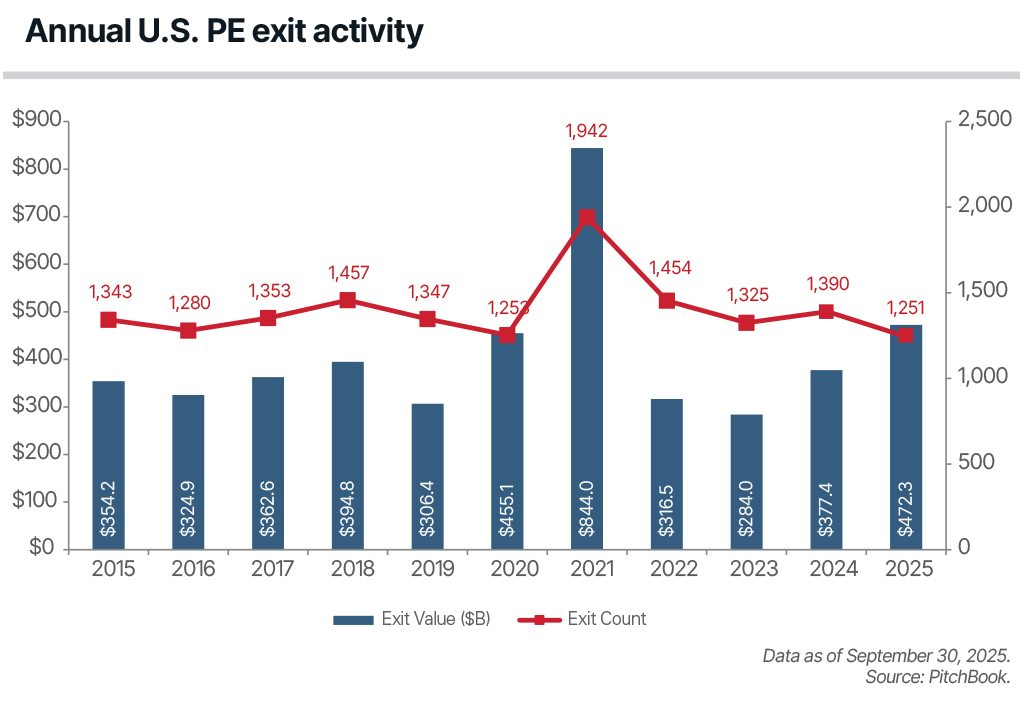
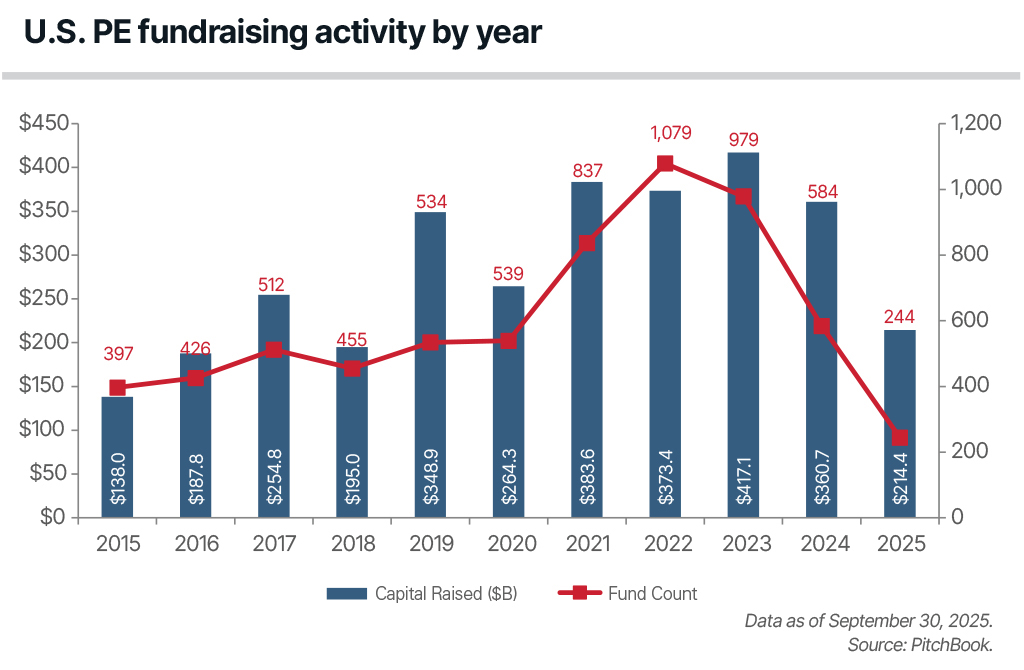
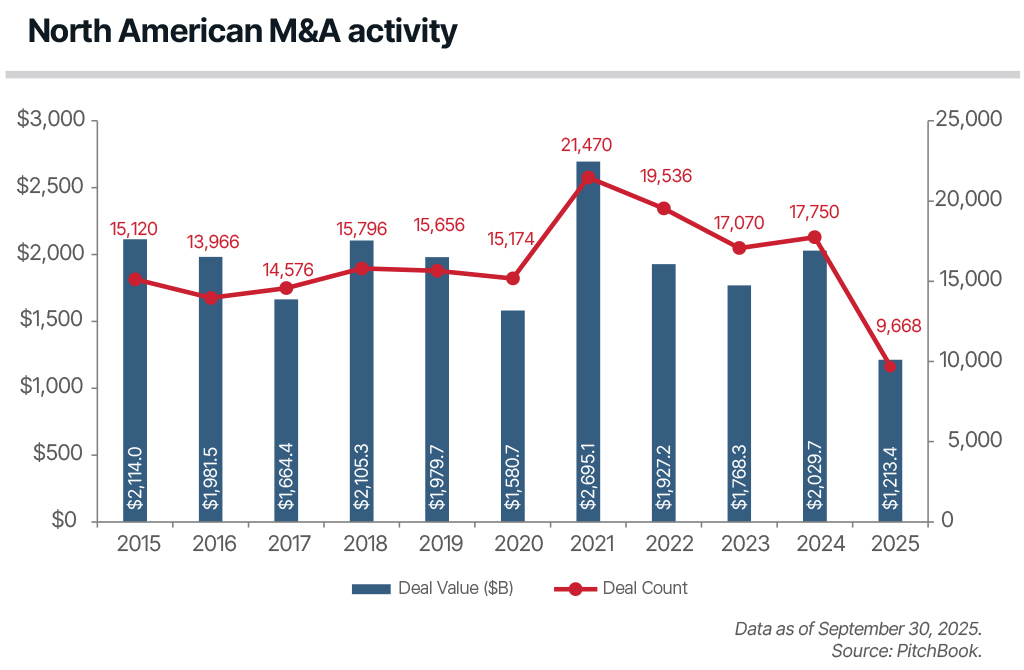
- Private equity (PE) and mergers and acquisitions (M&A) markets
The following article examines the state of the economy as we approach year-end, with improved expectations for economic growth and a reinstated rate-cutting cycle, caution among U.S. banks and trends of yield compression, and encouraging signals emerging for PE and M&A despite a mixed macroeconomic backdrop.
The economy
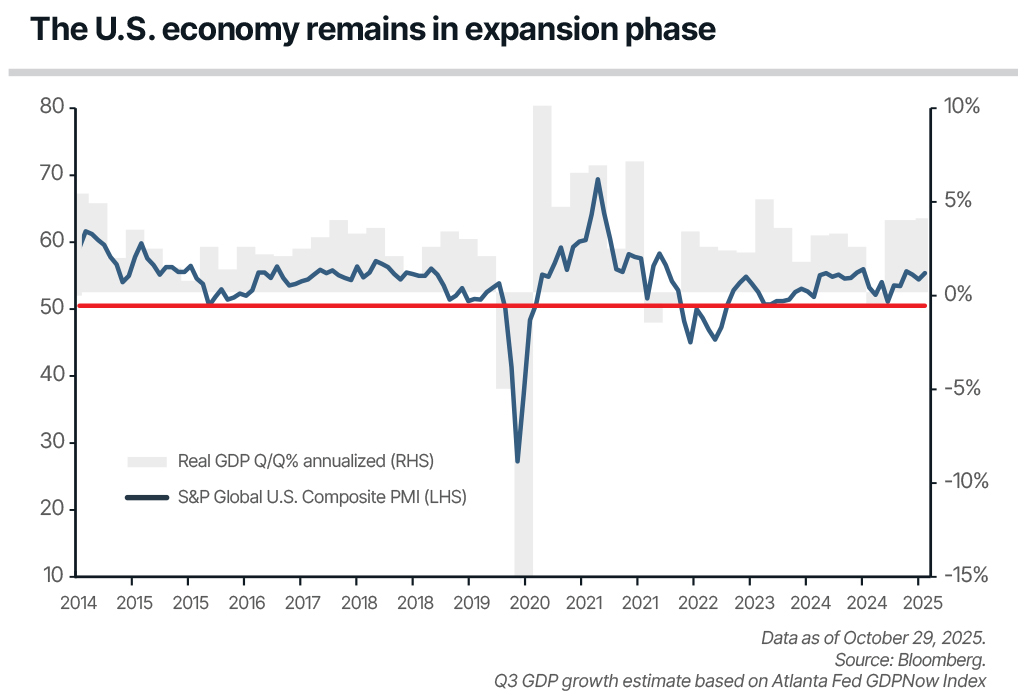
According to the U.S. Bureau of Economic Analysis, U.S. real gross domestic product (GDP) expanded at a quarter-over-quarter annualized rate of 3.8% in second quarter 2025. Driven by a surge in imports, which are a subtraction in the GDP growth calculation, first quarter GDP declined as companies bought goods ahead of the Trump administration’s tariff policy.
Second quarter 2025 real GDP growth was driven by a decline in imports and an increase in consumer spending. The personal consumption expenditure (PCE) component of GDP – which drives 70% of GDP over the long run – advanced 2.5%, an acceleration of the 0.6% growth reported in the first quarter, with increases in both services and goods.
Shifting to the U.S. labor market, after downward revisions to May and June, the three-month average gain in nonfarm payrolls declined to 29,000 in August,1 the lowest in more than five years. The U.S. labor market is beginning to show more softness, particularly as the number of U.S. job openings has declined to 7.2 million, down by roughly 40% from its March 2022 peak and roughly 1% below its pre-COVID-19 peak set in January 2019.
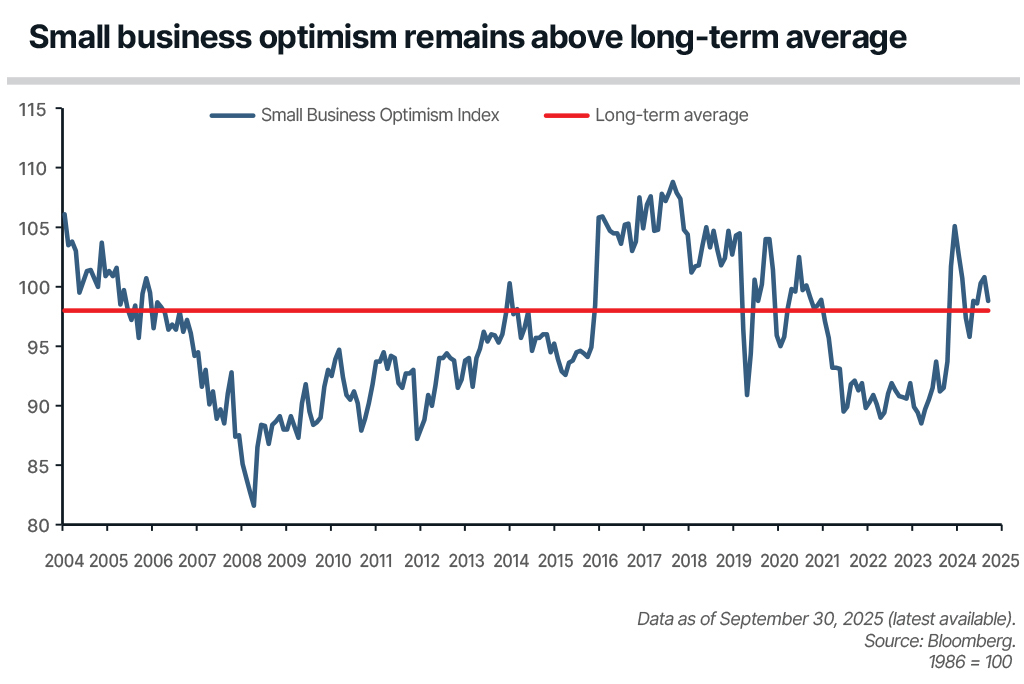
Meanwhile, small business optimism, according to the NFIB Small Business Optimism Index, decreased by 2.0 points in September to 98.8. This was the first decline in three months, though it remains above the survey’s 52-year average of 98.
Expectations for economic growth, lower inflation, and positive business conditions have improved under the pro-business policies of the Trump administration. While small business optimism has remained above the long-term average, 18% of business owners cited labor quality as the most important issue their businesses are facing today.2