

Chart 2: Chart depicting the U.S. budget balances from 1929 to 2025. The federal budget has posted a surplus in 14 of the past 96 years, and four of the past 50 years, when merger and acquisition activity associated with the dot-com boom led to a sharp rise in tax revenues from 1998 to 2001.
A brief history of federal debt
If, as Benjamin Franklin once observed, the only certainties in life are death and taxes, then the corollary certainties of the federal government seem to be debt and deficits.
Our national dance with debt started early: The Continental Congress lacked the authority to impose taxes on individuals or trade, and therefore had no real choice but to finance the Revolutionary War with borrowed funds. Our young nation (even before it was technically a nation) first issued debt on June 22, 1775, just days after the Battle of Bunker Hill, when Congress sold $2 million in short-term bills to support the war effort. The investors in this first debt issue were largely wealthy landowners, the French government (eager to destabilize its enemy England), and the Dutch government (always interested in expanding Dutch financial influence).
After the signing of the Declaration of Independence, Alexander Hamilton argued that the new nation should assume these debts previously incurred by the colonies, a contentious suggestion memorably dramatized in “Cabinet Battle #1” of Lin-Manuel Miranda’s musical “Hamilton.” Hamilton, our first secretary of the Treasury, understood how important debt was as the U.S. was establishing its economic footing as an independent nation:
The United States debt, foreign and domestic, was the price of liberty. The faith of America has been repeatedly pledged for it … . Among ourselves, the most enlightened friends of good government are those whose expectations of prompt payment are the highest. To justify and preserve their confidence; to promote the increasing respectability of the American name; to answer the calls of justice; to restore landed property to its due value; to furnish new resources, both to agriculture and commerce; to cement more closely the Union of the States; to add to their security against foreign attack; to establish public order on the basis of an upright and liberal policy; these are the great and invaluable ends to be secured by a proper and adequate provision, at the present period, for the support of public credit.1 |
When Hamilton penned these words in the “First Report on the Public Credit” in 1790, outstanding federal debt totaled $71,060,509. It’s risen a bit since then: As of June 30, 2025, federal debt stands at $36,211,469,351,821.30. That’s a little over $36 trillion for those who easily lose track of so many commas.
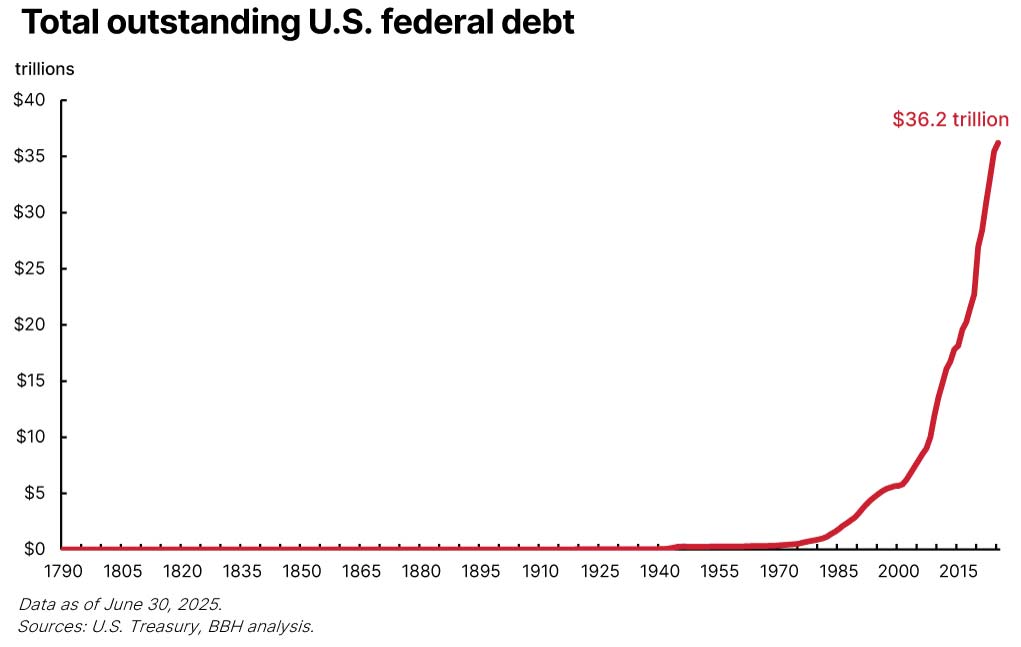
Chart 1: Chart depicting the total outstanding U.S. federal debt. As of June 30, 2025, federal debt stood at $36.2 trillion.
The nearby graph illustrates in graphic (and alarming) detail how rapidly our gross national debt has risen over the past 50 years. Total debt first crossed above $1 trillion in 1982, passed the $10 trillion mark in 2008, hit $20 trillion in 2017, and exceeded $30 trillion by the end of 2022. The Congressional Budget Office (CBO) projects that we will pass $40 trillion of debt by the end of 2027. To be precisely fair, some of this debt represents intra-governmental loans, such as surpluses held by the Social Security trust fund, or military retirement funds, and invested in Treasuries. As these loans represent perfectly matched assets and liabilities of the federal government, they should arguably be excluded from a consideration of true (net) public debt.
The good news is that these intra-governmental loans reduce the current total debt figure by almost $7.3 trillion. The bad news is that this adjustment still leaves almost $29 trillion of debt held by the public. Our situation is not meaningfully improved.
The role of budget deficits
Total debt is a function of the cumulation of prior deficits. When a nation spends more than it takes in, the resulting deficit is financed through debt issuance. If debt is issued more rapidly than it matures, the national debt rises. The twin challenge of rising deficits and debt is often (and justifiably) conflated, but it is worth noting that one (deficits) leads to the other (debt) – an important distinction when it comes to considering how we might address the problem.
Our national addiction to debt is largely a result of our national addiction to deficits. The federal budget has posted a surplus in just 14 of the past 96 years, and only four of the past 50 years, when the merger and acquisition activity associated with the dot-com boom led to a sharp rise in tax revenues from 1998 to 2001.
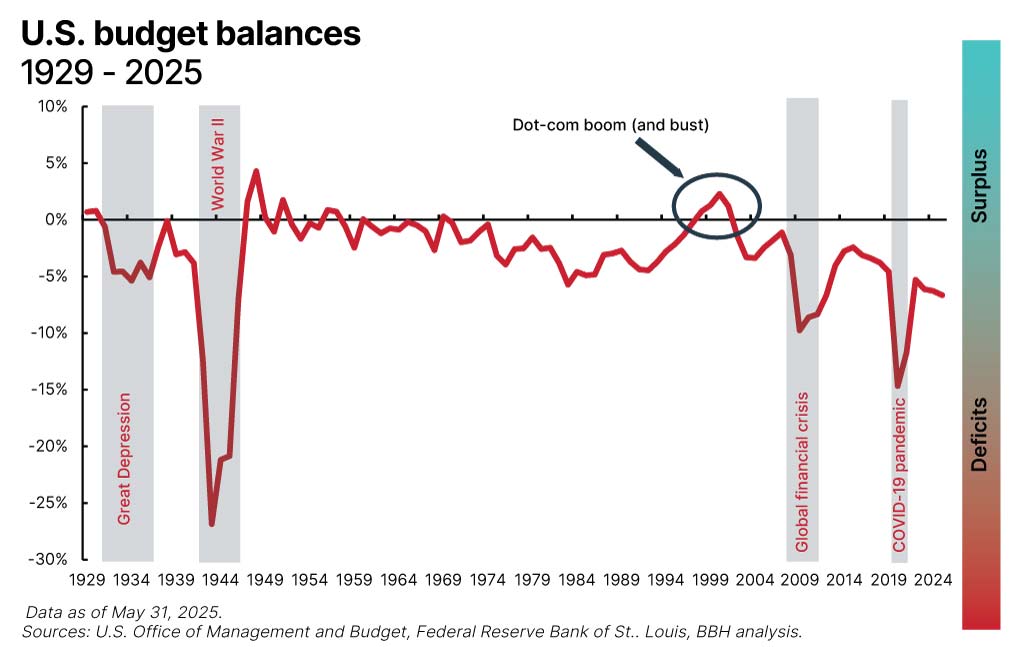
Deficits understandably deepen in periods of economic or national emergency, such as recessions or war, as federal spending rises to meet spending needs that the private sector can’t fulfill. As an extreme example from history, the war effort in the 1940s ballooned the deficit out to a record of 27% of gross domestic product (GDP) in 1943, but fiscal austerity following the war returned the budget to a surplus by 1947. Between World War II and the global financial crisis (GFC), the budget deficit averaged about 1.5% of GDP, worsening during recessions, but generally improving once economic conditions improved.
The renewed attention to debt and deficits is due in no small part to the fact that the cyclicality of budget deficits and surpluses seems to have foundered over the past few decades, or, perhaps more accurately, remained cyclical around a worsening secular trend. The federal budget balance dropped to almost -10% during the GFC, but only recovered to -2.4% in 2015, before plummeting again to -15% in 2020 due to pandemic-era fiscal stimulus. As of May 2025, the trailing-12-month deficit stands at 6.7%, an unprecedented level in U.S. history outside periods of recession or war.
Debt to GDP
The previous consideration places deficits into the context of GDP, and it is only fair that we complete the historical survey by doing likewise with debt. After all, debt in a vacuum reveals very little about the financial health of an entity. Just as we might consider a ratio of debt to assets, cash flow, or EBITDA in assessing the financial health of a company, we should similarly compare a nation’s debt to a measure of economic activity or “earnings.” That measure for an economy is GDP, or the total annual economic output of a nation.
The historical dynamic in the nearby chart will be familiar by now. Debt to GDP rose sharply in the early 1940s as the U.S. geared up to fight a world war on two fronts, peaking at 119% in 1946. From that peak, debt to GDP fell steadily as military spending waned and the economy pivoted back to private enterprise. For the record, the post-war trough was a debt-to-GDP ratio of 31% in 1981.
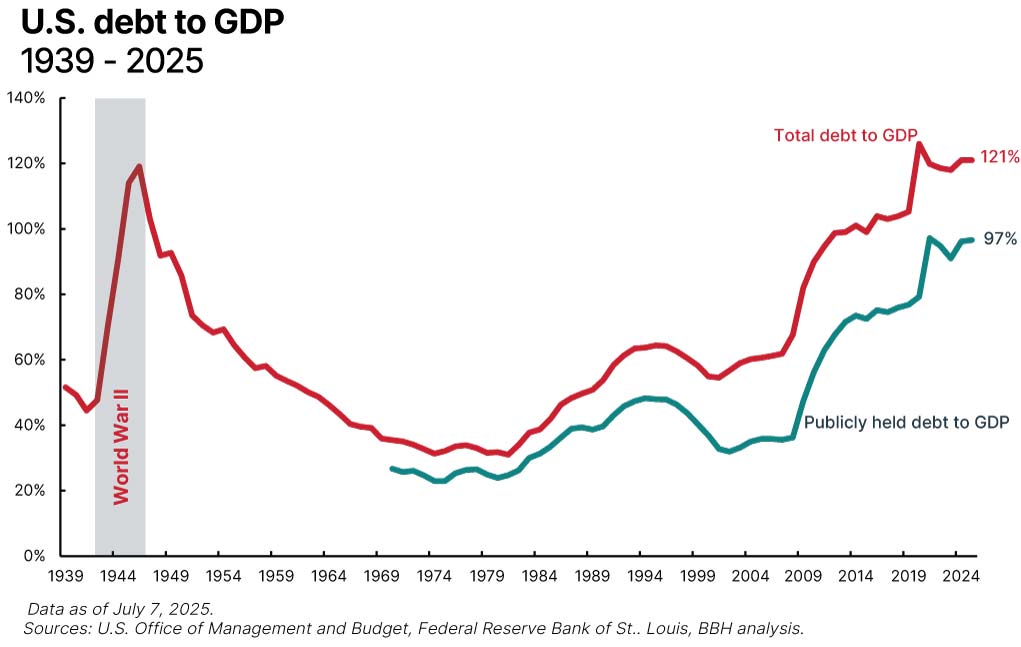
Chart 3: Chart depicting U.S. debt to GDP from 1939 to 2025. As of July 7, 2025, total debt to GDP stands at 121%, while publicly held debt to GDP stands at 97%.
The gross debt-to-GDP ratio has come full circle some 75 years after the end of World War II, to stand at 121% as of mid-2025, slightly down from the pandemic peak of 126%, but above the peak spending associated with World War II. Adjusting this ratio to remove intra-governmental debt (discussed earlier) lowers the ratio to 97%, a directional improvement, but not one that solves the underlying problem of a rapidly rising trend. Regardless of whether we calculate this ratio on total (gross) debt or only the (net) debt held by the public, both the direction and level of this graph are increasingly worrisome.
And it’s likely to get worse before it gets better. According to multiple analyses, the recently passed One Big Beautiful Bill (OBBB) will likely add around $3.4 trillion to the deficit (and therefore debt) over the next decade. To be fair, the CBO was already forecasting trillion-dollar deficits for the next few years even before this legislation, so the OBBB doesn’t bear the sole blame for the debt and deficit problem, although it is likely to exacerbate it. Note that the CBO projections also make no assumption about future economic cycles, so any slowdown in growth would amplify these deficits.
Conversely, supporters of the bill claim that these forecasts underestimate the boost to economic growth and therefore the tax revenues that the provisions of the bill will unlock, thereby lowering deficits and debt to GDP. And this may be right: We will see shortly that robust growth is one path out of the debt and deficit morass in which we currently find ourselves.
Before transitioning to the solution set, let us briefly broaden our view and place the U.S. situation into a global context. Ours is not the only economy to wrestle with the challenges of geopolitics, economic cycles, aging populations, rising healthcare costs, and the occasional national emergency. More mature economies with aging populations tend to have higher debt burdens: see Japan and Italy, in particular. Conversely, emerging economies with younger populations or less developed social infrastructure tend to have smaller debt-to-GDP ratios: see Brazil and China, for example.
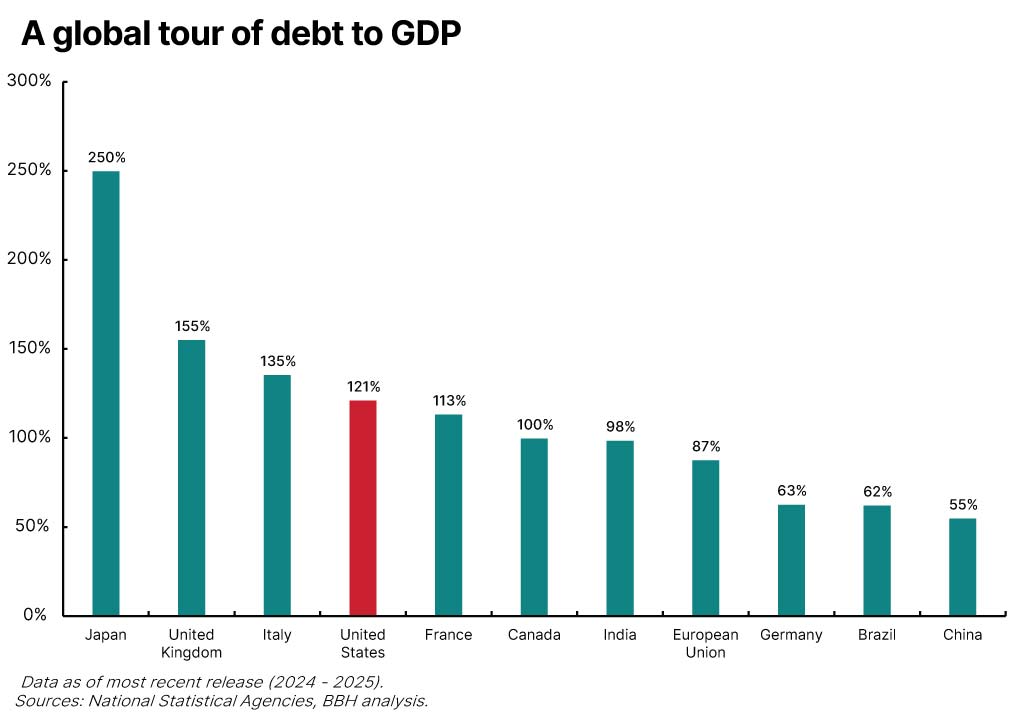
Chart 4: Bar graph depicting the debt-to-GDP ratios across Japan, the UK, Italy, the U.S., France, Canada, India, the EU, Germany, Brazil, and China. As of the most recent release (2024 – 2025), the latest figures are 250%, 155%, 135%, 121%, 113%, 100%. 98%, 87%, 63%, 62%, and 55%, respectively.
At 121% of GDP, the U.S. debt level is not an outlier in the global scheme of things, but the trends outlined earlier indicate that unless we act, debt and deficits will become more and more of a problem.
The solutions
U.S. economist Herbert Stein coined the humorous and ominous economic principle that bears his name. Stein’s Law holds that “that which cannot go on forever will stop.” Ironically, Stein first applied this principle to the very subject of debt and deficits as far back as 1986, when debt to GDP was a modest 46%, proving that although unsustainable trends must eventually come to an end, “eventually” can be a long, long time.
How might Stein’s Law apply to our current circumstances? If this seemingly inexorable rise in debt and deficits is to end, what might that look like? We see five potential paths forward, none of which is mutually exclusive:
- The most appealing solution is robust real economic growth, which would allow deficits and debt to GDP to fall as economic growth accelerates.
- Inflation will likely play a role as well, as it mitigates the real debt burden by reducing the inflation-adjusted value of future debt payments.
- Fiscal solutions might involve simply spending less money or …
- Expanding revenue through higher (or different) taxes.
- Finally, in the interest of making our solution set truly exhaustive, we must consider the possibility of outright default.
To address our debt and deficit challenges effectively will almost certainly require a combination of these solutions, each of which warrants its own comprehensive analysis. In the pages that follow, we’ll briefly review each in turn, and then conclude with a consideration of the implications for investors.
If we define our essential debt challenge not in absolute terms, but relative to GDP, then robust economic growth would cover a multitude of fiscal sins. Simply put, fast growth in the denominator of the debt-to-GDP ratio would solve the problem without the hard choices of spending less or raising taxes. This solution is alluring in its appeal, but, alas, easier said than done. Over the past 50 years, outstanding federal debt has grown at an annualized pace of 8.8%, implying that the economy would need to expand faster than that (in nominal terms) for growth alone to solve the problem. The economy has grown this fast for a quarter or two, almost always in a rebound from a recession, but never on a sustainable basis.
[F]ast growth in the denominator of the debt-to-GDP ratio would solve the problem without the hard choices of spending less or raising taxes. This solution is alluring in its appeal, but, alas, easier said than done.”
In the long run, economic growth is a function of two variables: growth in the labor force and productivity. Labor force growth is almost a fixed variable and has declined over the past few decades as birth rates have dropped. Other nations (China, notably) have tried to increase birth rates through policy, but to no avail. Policies of the current administration make it highly unlikely that immigration will help to boost labor force growth, so productivity and technology are all that is left.
History offers a curious lesson in the economic benefit of technology: The promise of productivity rarely translates into reality. Consider, for example, the introduction of computing technology into corporate America in the 1970s and 1980s. As businesses and individuals integrated computers into their professional and personal lives, the measurable impact on productivity was negligible, or even negative. The quarterly data shown in the nearby chart is noisy, but from the 1940s through the 1960s, productivity growth (measured as output per unit of labor input) grew at an average annual pace of 2.8%. As computers permeated the economy in the 1970s and 1980s productivity still grew, but at a more modest average pace of 1.7%.
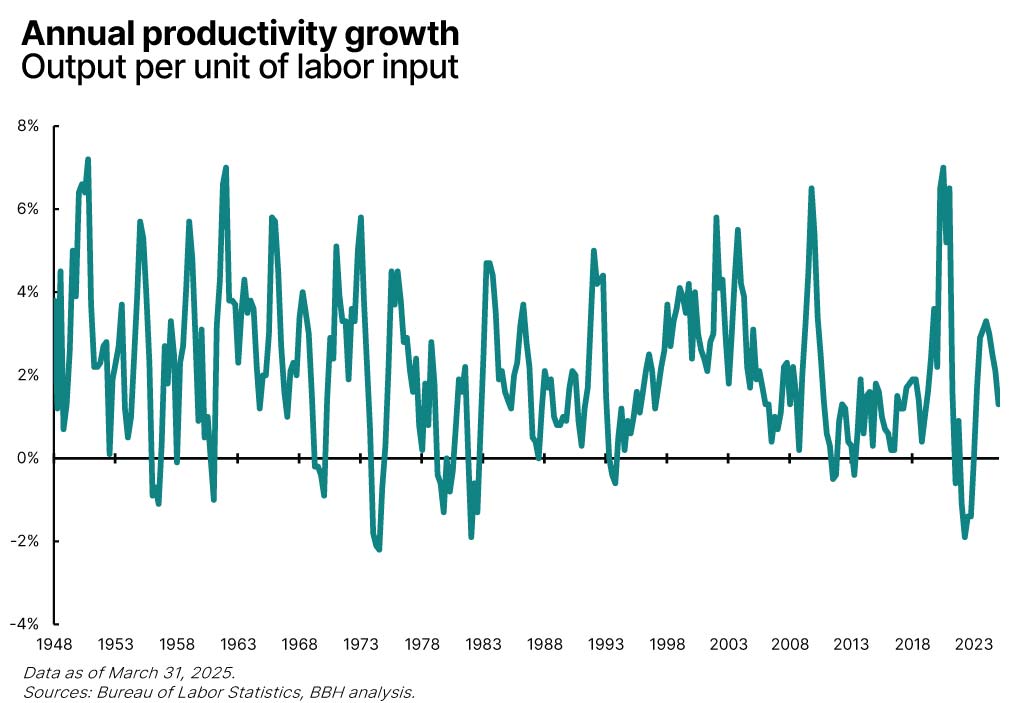
Chart 5: Chart depicting annual productivity growth measured as output per unit of labor input. The latest figure is 1.3% as of March 31, 2025.
This absence of measurable productivity gains prompted economist Robert Solow to wryly observe, “You can see the computer age everywhere but in the productivity statistics.” This so-called “productivity paradox” has been explained away as a delayed benefit (productivity growth averaged 2.1% in the 1990s), or a mismeasurement, but the historical record speaks volumes that technology is not, or at least has not been, the panacea that the evangelists of Silicon Valley would have us believe.
The promise of artificial intelligence may very well make these historical examples moot. It is possible that we are on the precipice of an unprecedented boom in productivity and therefore economic activity. It would be imprudent, nevertheless, to rely solely on this promise of outsized GDP growth to solve our debt problems. Hope is not a strategy.
Note that we have so far written only in nominal terms, ignoring (up until now) the effect of inflation on these debt, deficit, and economic dynamics. We’ve done that in order to focus specifically on inflation as a potential “solution” for our debt challenge. We employ scare quotes here to underscore that the inflation isn’t an appealing approach to addressing our growing debt burden, particularly for investors.
Regular readers will be familiar with the miracle of compound interest: how a small amount of money can compound, even at a modest rate of interest, into a great fortune. Inflation is the evil twin of compounding. Inflation can turn a great fortune, even at a modest rate of inflation, into a small amount of purchasing power. Inflation is therefore a debtor’s best friend, as it reduces the real liability of debt over time.
This is not to argue that inflation would ever become the explicit policy of the U.S. government in an effort to reduce the debt burden, but benign neglect can go a long way. Yet interest rates provide a self-correcting market mechanism that responds to rising inflation rather quickly. If lenders (bond investors) conclude that the government or the Federal Reserve is growing complacent about inflation, they will demand higher rates of interest to compensate for this rising risk. This ultimately leads to higher debt service and deeper deficits, thereby exacerbating the very problem that inflation was expected to address. The law of unintended consequences is not subject to repeal.

Modest inflation is likely to remain one factor restraining the growth in the real burden of debt, but the market will provide painful discipline through higher interest rates if inflation fears escalate too much.
Here we are, deep into this commentary, and we finally come to perhaps the most obvious solution: If our national fiscal problem is a function of overspending, maybe we should simply spend less. As with the other solutions covered herein, cutting spending is easier said than done.
Government outlays fall into three categories:
- Mandatory spending is determined by existing law and is not subject to annual budget appropriations. This category includes Social Security, Medicare, Medicaid, federal military and civilian retirement plans, and veterans’ disability benefits, among others. This is not to say that this spending can’t be changed, only that cutting this category requires a change of law distinct from the annual budget process. As the nearby graph illustrates, mandatory spending accounts for almost two-thirds of annual federal government outlays.
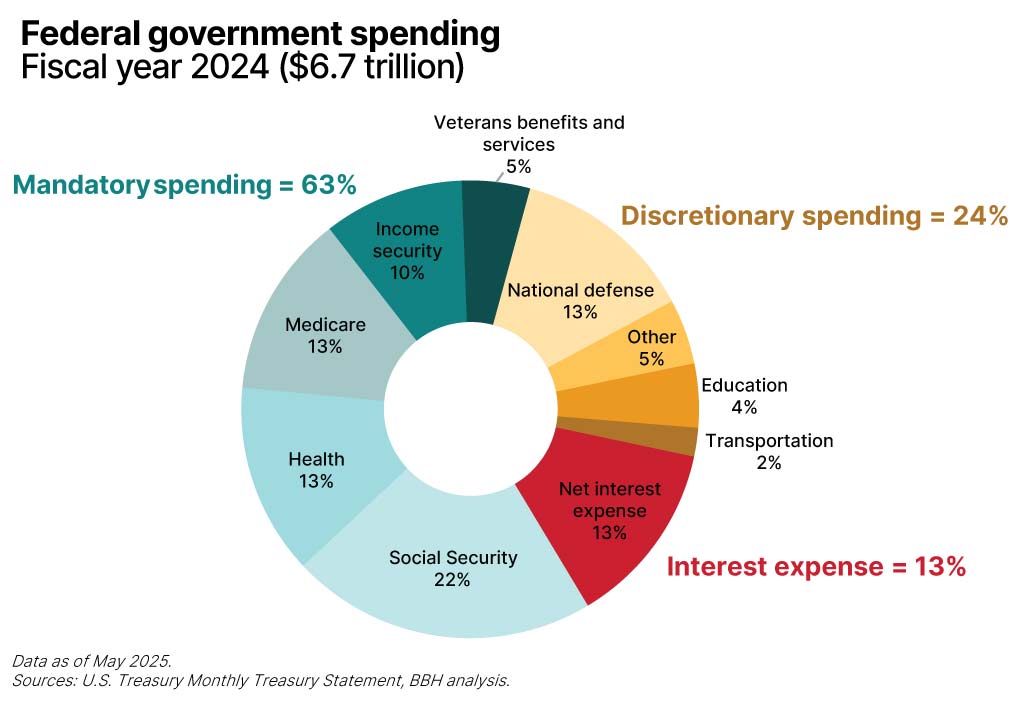
Chart 6: Pie chart showing federal government spending in fiscal year 2024, which totaled $6.7 trillion. As of May 2025, mandatory spending accounted for 63%, discretionary spending for 24%, and interest expense for 13%.
- Discretionary spending is easier to cut, as it is set by the annual budget process and does not require legislative change. This category includes defense spending, education, international affairs (such as USAID), government agency operating budgets, research and medical grants, community and regional development, and transportation. Discretionary spending represents 24% of total federal outlays.
- Interest on the national debt, the final category, is mandatory for all intents and purposes. In the last full fiscal year, debt service amounted to $882 billion, or 13% of total government spending. Notably, interest expense last year exceeded spending on national defense for the first time in our history.
The challenge is painfully obvious: So much of federal spending is mandatory that cuts are hard to find. About 75% of government spending is locked in even before the annual budget process starts. The four big spending categories of Social Security, Medicare, Medicaid, and defense accounted for 61% of all spending in 2024, and this has been true for decades.
Peter Fisher, former undersecretary of the Treasury, once remarked that the U.S., at least financially, resembles a giant insurance company with an army. There seems to be little political will to make serious cuts in any of these categories, as politicians would no doubt pay a price at the ballot box come election day.
The Department of Government Efficiency (DOGE) under the leadership of Elon Musk learned these difficulties firsthand earlier this year. According to the department’s own website, DOGE has identified $190 billion of savings as of June 29, 2025. This seems on first glance like a great deal of money. Leaving aside how much of this claim can actually be accomplished, this is equivalent to a mere 2.8% of the outlays detailed in the pie chart nearby. All else being equal, this would have reduced last year’s fiscal deficit from $1.8 trillion to $1.6 trillion. We should by all means identify and rectify waste, fraud, and abuse where it exists, but there is not enough to make more than a dent in the size of our debt and deficits.
The DOGE experience raises another general point. We human beings are not naturally conversant in such large numbers. Many of us deal in millions, particularly in matters of finance or business. Trafficking in billions is rare territory, and unless you are an astrophysicist or molecular biologist, you almost certainly don’t deal with measurements in the trillions. It is easy to think subjectively that all of these units of measurement represent “really big numbers,” but they are vastly, vastly different.
To illustrate the point, consider that a million seconds is about 12 days. A billion seconds ago, however, was 1993. A trillion seconds ago? The year 30,000 B.C. Saving millions – or even billions – in pursuit of a debt and deficit challenge measured in trillions is quixotic at best.
If spending less won’t get all the way toward our goal of fiscal prudence, maybe we should find ways to make more – that is, to increase the sources of federal income. Similar to what we saw with the analysis of government spending, a few categories account for the vast majority of receipts as well, which makes the task difficult.
By far the largest source of federal revenues is individual tax payments, followed closely by payroll tax payments into various social insurance programs (again, the dominance of Social Security, Medicare, and Medicaid in our national finances is evident). Corporate taxes amount to only 11% of total receipts, and all other sources of revenues (including customs duties, tariffs, and estate and gift taxes) are close to rounding errors. Note that the total for federal receipts in 2024 was $4.9 trillion, compared to the $6.7 trillion of spending detailed in the last few paragraphs. The difference of $1.8 trillion is last year’s deficit.
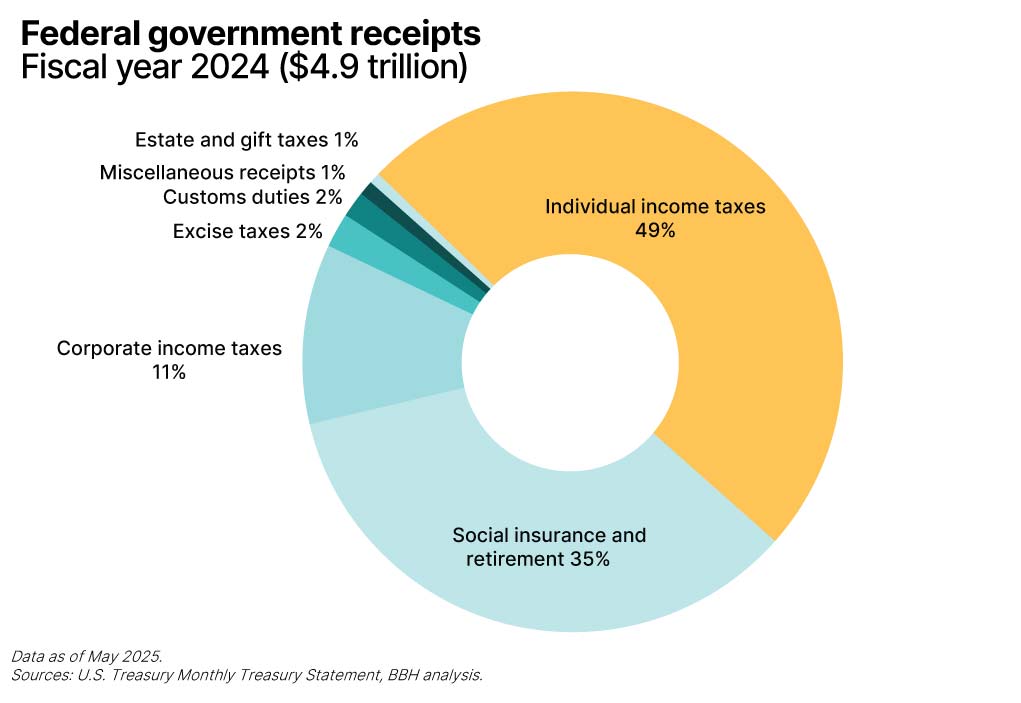
Chart 7: Pie chart showing federal government receipts in fiscal year 2024, which totaled $4.9 trillion. As of May 2025, individual income tax accounted for 49%, social insurance and retirement for 35%, corporate income tax for 11%, excise tax for 2%, custom duties for 2%, misc. receipts for 1%, and estate and gift taxes for 1%.
Let’s focus on the largest category of individual income taxes and see if we can close this $1.8 trillion gap through this revenue source alone. Our individual income tax structure is already quite progressive. The nearby graph illustrates the trend in effective (not statutory) tax rates by quintiles of household income, with the top 1% of households detailed in red. This data aggregates and averages individual income tax payments as a percentage of total income, so incorporates tax credits and deductions, but does not include payroll taxes. Note that the data extends only through the 2019 tax year, as the tax benefits associated with the pandemic wreak havoc with the data starting in 2020.
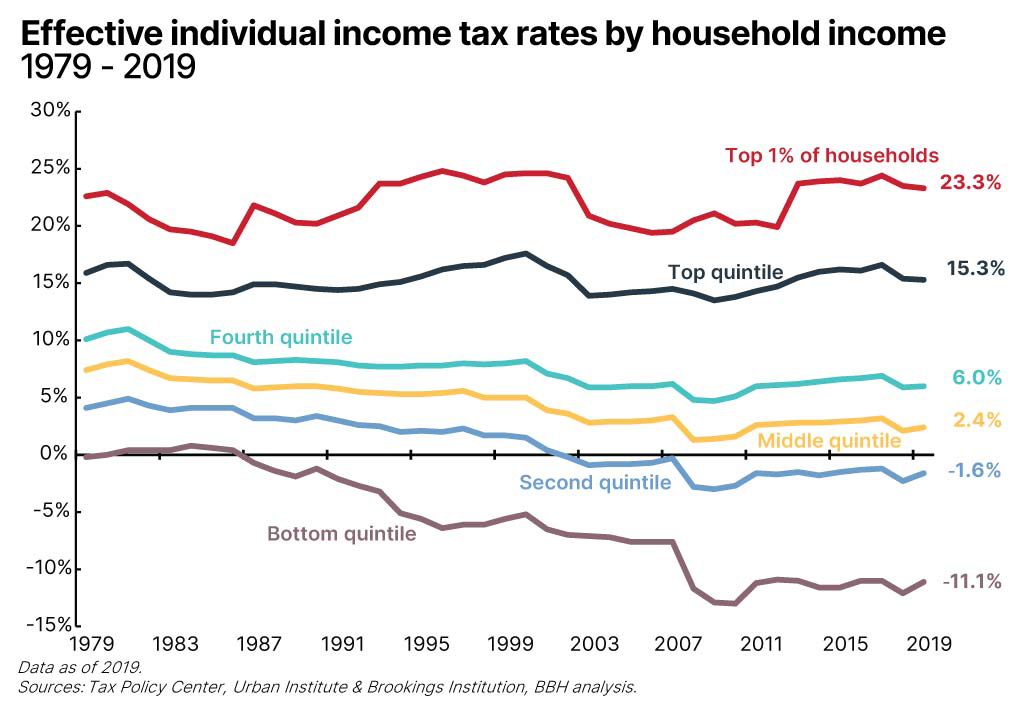
Chart 8: Chart tracking the effective individual income tax rates from 1979 through 2019 between the top 1% of households and the top, fourth, middle, second, and bottom quintiles of household income. As of June 2019, the latest figures are 23.3%, 15.3%, 6.0%, 2.4%, -1.6%, and -11.1%, respectively.
More than 40% of households (the bottom two quintiles in the nearby graph) have negative effective tax rates, due largely to benefits such as the earned-income tax credit and the child tax credit. The top quintile of households pays an average individual income tax of 15.3%, and the top 1% of households (making more than about $800,000 per year, on average) pay an average rate of 23.3%.
Here again a simple calculation illustrates the intractability of the problem. The top 1% of U.S. households comprise roughly 1.3 million taxpayers, with average annual income of about $780,000. If we were to tax all of this income at an effective (not marginal!) rate of 100%, it would generate revenues of a little over $1 trillion, leaving the deficit $800 billion in the hole. This is, of course, a Swiftian proposal. No one is proposing a tax hike to 100%, or, indeed, tax hikes at all given the recent passage of the OBBB.
Placing the U.S. tax experience into a global context offers an interesting avenue of inquiry. Comparing tax burdens across borders is difficult, because there are as many different tax regimes on the planet as there are taxing authorities, but at the highest level – and taking into account all forms of taxation, not just individual income taxes – the tax burden in the U.S. relative to GDP is relatively modest.
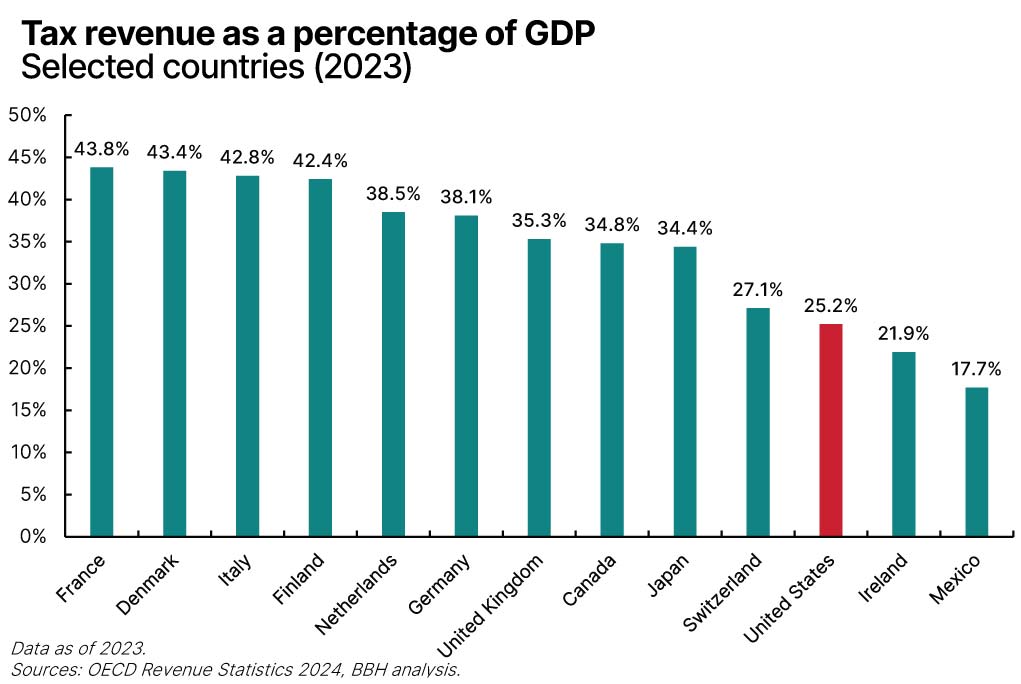
Chart 9: Bar graph depicting tax revenue as a percentage of GDP across France, Denmark, Italy, Finland, the Netherlands, Germany, the UK, Canada, Japan, Switzerland, the U.S., Ireland, and Mexico. The latest figures as of 2023 are 43.8%, 43.4%, 42.8%, 42.4%, 38.5%, 38.1%, 35.3%, 34.8%, 34.4%, 27.1%, 25.2%, 21.9%, and 17.7%, respectively.
This graph won’t surprise most readers. Europe (and the Nordic countries, in particular) is known for imposing higher taxes on just about everything. Tax revenues to GDP in Canada are almost 10 percentage points higher than in the U.S., and in the nearby graph, only Ireland and Mexico have lighter tax burdens relative to the size of the economy than we do in the U.S. (For the record, Turkey, Chile, Colombia, and Costa Rica also have lower tax burdens than the U.S. relative to GDP.)
There is a simple reason for this apparent disparity in tax burdens. Every country on this graph except the U.S. has a national value-added tax (VAT) or a goods and services tax applied to consumption. Indeed, 175 countries and over 90% of the world’s population live with a national consumption tax. The U.S. is an outlier.
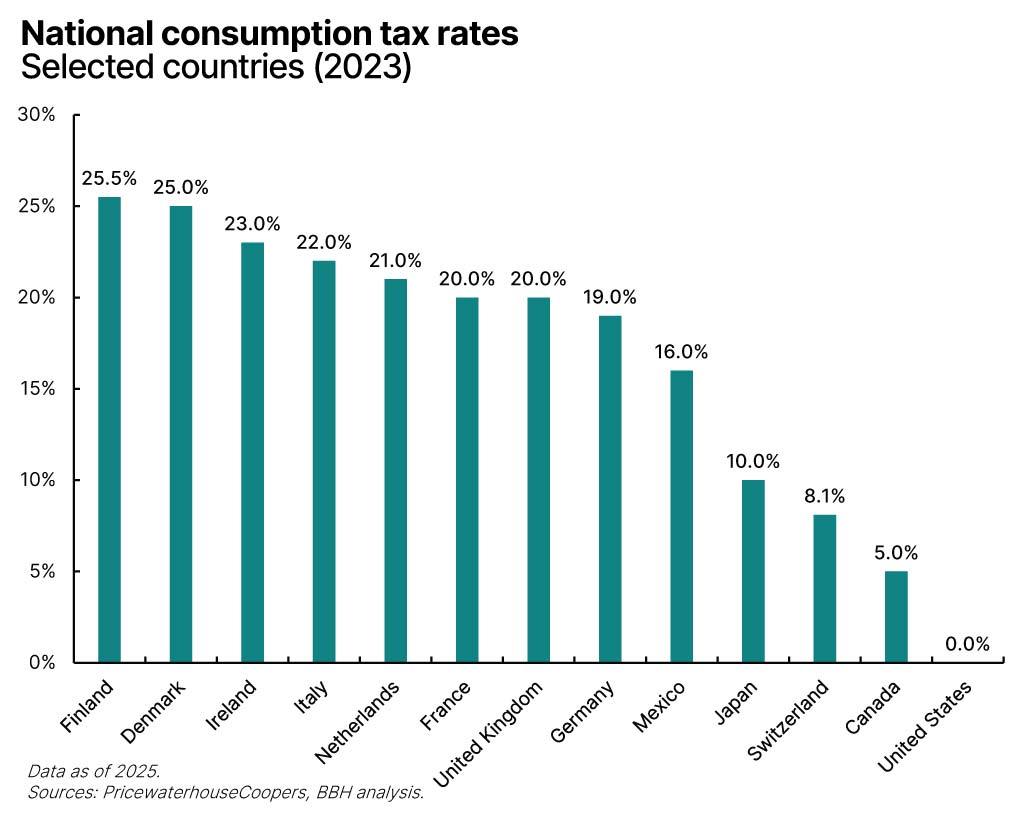
Chart 10: Bar graph depicting national consumption tax rates across Finland, Denmark, Ireland, Italy, the Netherlands, France, the UK, Germany, Mexico, Japan, Switzerland, Canada, and the U.S. The latest figures as of 2023 are 25.5%, 25.0%, 23.0%, 22.0%, 21.0%, 20.0%, 20.0%, 19.0%, 16.0%, 10.0%, 8.1%, 5.0%, and 0.0%, respectively.
Herein lies an intriguing thought experiment. Personal consumption is the largest driver of economic activity in the U.S., amounting to more than $20 trillion over the past year. A 10% VAT applied to this level of consumption would generate around $2 trillion of tax revenue, all else being equal, more than covering our current level of deficit. Furthermore, a national consumption tax at this level would still leave us far below similar consumption taxes applied elsewhere in the world.
As with so much else in this article, this is easier said than done. The math and economics work all day long, but politics is a different matter. Many states and cities already have sales or use taxes. Would a national tax supplant those existing taxes or be incremental? The cost of compliance is meaningful at the point of sale, although other countries have figured it out, and technology should mitigate this challenge. From a social standpoint, perhaps the biggest obstacle is that consumption taxes are regressive: Poorer households bear a greater burden relative to income than wealthier households.
Yet the point remains: Leaving aside the societal issues of a more regressive tax regime, if we need to substantially raise revenues, a broader tax base such as that offered by a consumption tax fits the bill.
None of the challenges outlined in these pages is new. As long ago as August 2011, Standard & Poor’s referenced them in lowering the U.S. sovereign debt rating to AA+ from AAA: “Our opinion is that elected officials remain wary of tackling the structural issues required to effectively address the rising U.S. public debt burden in a manner consistent with a ‘AAA’ rating and with ‘AAA’ rated sovereign peers.”2 This downgrade took place almost 15 years ago, in the wake of the GFC and as Congress played one of its regular games of economic chicken with the debt ceiling.
It took some time, but Fitch followed suit with a rating downgrade from AAA to AA+ in August 2023, and Moody’s rounded out the trifecta by lowering its rating of the U.S. from Aaa to Aa1 in May 2025. Moody’s noted that the downgrade “reflects the increase over more than a decade in government debt and interest payment ratios to levels that are significantly higher than similarly rated sovereigns.”3 The press release went on to observe that:
Successive US administrations and Congress have failed to agree on measures to reverse the trend of large annual fiscal deficits and growing interest costs. We do not believe that material multi-year reductions in mandatory spending and deficits will result from current fiscal proposals under consideration. Over the next decade, we expect larger deficits as entitlement spending rises while government revenue remains broadly flat. In turn, persistent, large fiscal deficits will drive the government’s debt and interest burden higher. The US’ fiscal performance is likely to deteriorate relative to its own past and compared to other highly-rated sovereigns. |
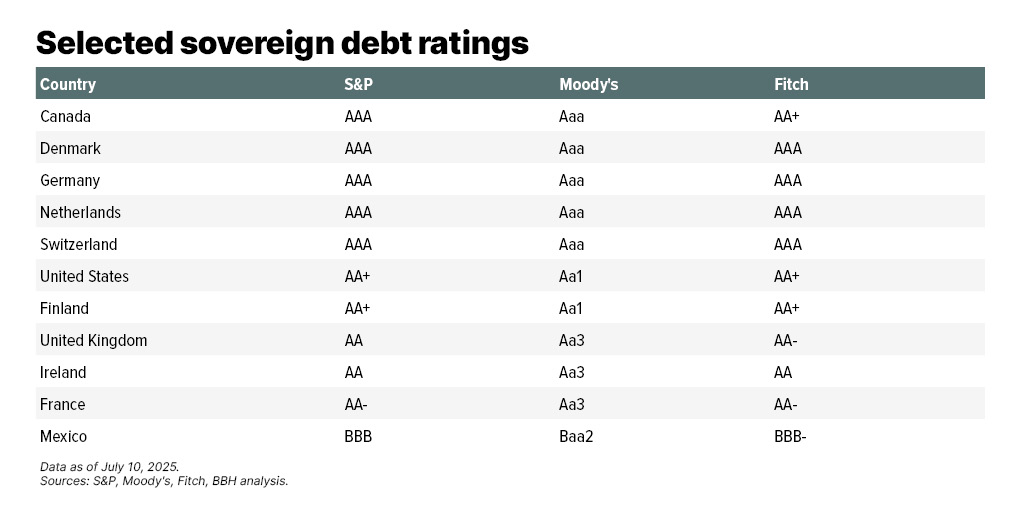
Selected sovereign debt ratings
| Country | S&P | Moody's | Fitch |
| Australia | AAA | Aaa | AAA |
| Canada | AAA | Aaa | AA+ |
| Denmark | AAA | Aaa | AAA |
| Germany | AAA | Aaa | AAA |
| Netherlands | AAA | Aaa | AAA |
| Sweden | AAA | Aaa | AAA |
| Norway | AAA | Aaa | AAA |
| Singapore | AAA | Aaa | AAA |
| Switzerland | AAA | Aaa | AAA |
| United States | AA+ | Aa1 | AA+ |
| Finland | AA+ | Aa1 | AA+ |
| New Zealand | AA+ | Aaa | AA+ |
| Austria | AA+ | Aa1 | AA |
| Taiwan | AA+ | Aa3 | AA |
| Hong Kong | AA+ | Aa3 | AA- |
| United Kingdom | AA | Aa3 | AA- |
| Ireland | AA | Aa3 | AA |
| France | AA- | Aa3 | AA- |
| Italy | BBB+ | Baa3 | BBB |
| Japan | A+ | A1 | A |
| Mexico | BBB | Baa2 | BBB- |
Nothing in these downgrades speaks explicitly of default, and the U.S. remains one of the highest-rated sovereign debt issuers on the planet, bested only by Canada, Denmark, Germany, the Netherlands, and Switzerland. The real import of these downgrades is to sound the alarm that, unless addressed, debt and deficits can rise to the point that default does become more likely, and that somewhere out there is a tipping point at which the options outlined in this piece are no longer available. At that undefined point, some sort of default becomes inevitable.
The real import of these downgrades is to sound the alarm that, unless addressed, debt and deficits can rise to the point that default does become more likely, and that somewhere out there is a tipping point at which the options outlined in this piece are no longer available.”
Financial markets provide some transparency into the waning and waxing of sovereign risk through credit default swaps (CDS), which allow investors to insure against the possibility of default. Swap spreads rise with anxiety, and trends over time illustrate aggregate market sentiment toward individual issuers. In the nearby table, the figures represent in basis points (bps)4 how much it costs to protect against the default of a sovereign issuer. A simple way to read the table is that the number in the second column represents how many dollars it currently costs to hedge $1 million of underlying value. For example, to hedge a $1 million five-year U.S. government bond costs a little over $40 per year at present.
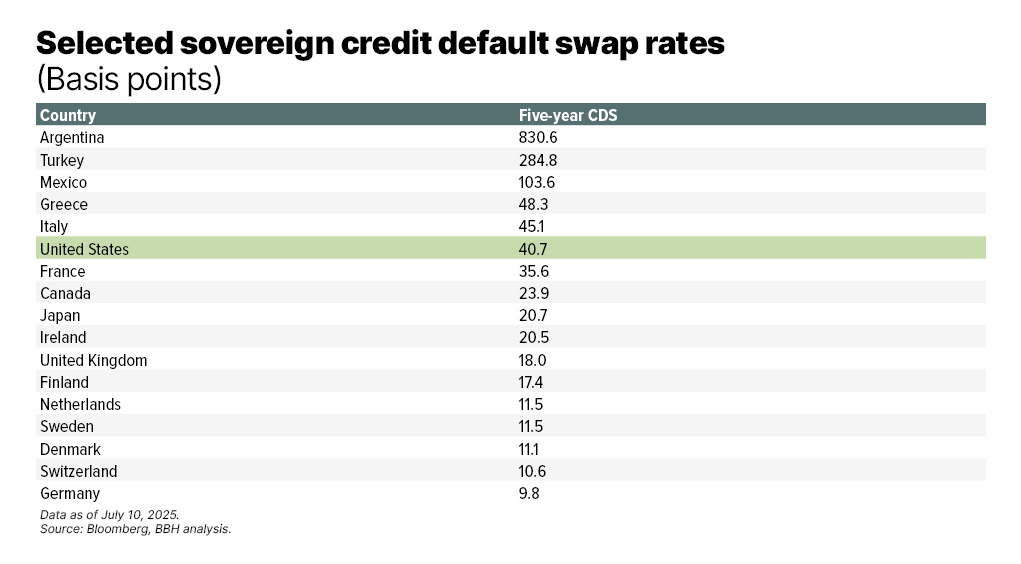
Selected sovereign credit default swap rates (basis points)
| Country | Five-year CDS |
| Argentina | 830.6 |
| Turkey | 284.8 |
| Mexico | 103.6 |
| Greece | 48.3 |
| Italy | 45.1 |
| United States | 40.7 |
| France | 35.6 |
| Canada | 23.9 |
| Japan | 20.7 |
| Ireland | 20.5 |
| United Kingdom | 18.0 |
| Finland | 17.4 |
| Netherlands | 11.5 |
| Sweden | 11.5 |
| Denmark | 11.1 |
| Switzerland | 10.6 |
| Germany | 9.8 |
CDS in the U.S. have ranged from a low of about 10 bps to a high of around 80 bps over the past few decades, indicating that anxiety about U.S. sovereign credit rises and wanes from time to time, but remains at a generally low level.
We typically associate sovereign defaults with spectacular economic collapse, social unrest, and political upheaval, but default need not be binary. There are variations on the theme, and rising default risk in the U.S. will more likely present itself as rising inflation and a weaker dollar. Inflation is itself arguably a soft form of default, albeit not in a contractual sense. Repaying debts with devalued purchasing power might not violate the legal terms of a bond contract, but it does seem to violate some sort of social contract.
There are examples throughout history of stronger forms of default, such as forced swaps. Greece in 2012, Argentina in 2005, and Ecuador in 2008 all forced bond holders to exchange their current bond holdings for newly issued debt with lower par values, lower interest rates, or longer maturities. Any of these changes represents a unilateral change to the terms of a contract. Of course, owners don’t have to accept a swap offer, but they are faced with the legal and opportunity costs of lengthy court battles.
A form of soft default has actually happened before here in the U.S.: During the Great Depression, newly elected President Franklin Roosevelt took the U.S. off the gold standard, and at the same time changed existing bond contracts to nullify the obligation to satisfy bond holders in gold. Bonds at the time carried the promise that the “principal and interest hereof are payable in United States gold coin of the present standard of value.” President Roosevelt (and the 73rd Congress) put an end to that, thereby changing the terms of the contracts without the consents of the bond holders.
We do not believe that the U.S. will ever explicitly default on its debt obligations, even though the previously unthinkable and unspeakable is spoken about a bit more often these days. It is hard to be forced into default when the U.S. enjoys the exorbitant privilege of having a monopoly on the production of the global reserve currency. Phrased differently, it’s easy to stay in business when you can always print more of the currency you need to service debt.
And yet the mere suggestion of default – whether soft or hard – would create enormous volatility in financial markets. Investors would quickly incorporate such risks into interest rates, with concomitant effects throughout the real economy as well. Complacency is the enemy of the investor, and change can happen quickly. In Ernest Hemingway’s “The Sun Also Rises,” a down-on-his-luck character is asked how he managed to wind up bankrupt. “Two ways,” he replies, “gradually, then suddenly.”5 Markets can remain complacent for a long time and then be quickly shocked into a new reality. There are decades when nothing happens, and there are weeks when decades happen.
What comes next?
Some of these paths forward are clearly more appealing or tolerable than others. We are bullish on the U.S. economy in the long run, and technology-fueled growth is likely to play a role in reducing the (relative) size of debt, but only if the deficit and debt grow more slowly than GDP. Inflation will play a part as well, if for no other reason than that no one votes for it. From a political standpoint, modest inflation is a “free” policy choice with no political price to pay – and one that helps to address the real burden of debt.
But growth alone (whether nominal or real) won’t solve the problem. There are policy choices to be made if we are to correct this course. We’ve seen that cutting federal spending is hard when so much of the federal budget is consumed by various entitlement programs and other mandatory spending. Serious spending cuts would require political will, so we don’t have much hope that tighter belts will be a big part of the solution. Revenues, on the other hand, offer more opportunity, but only if we can find a way to broaden the tax base.
Finally, we reiterate once again that outright default is a remote possibility. Americans’ role in the global economy, and the dollar’s role as the global reserve currency, bestows immeasurable benefits on U.S. businesses and households through lower interest rates and cheaper goods and services. To risk this through default is to risk the bedrock of the U.S. economy.
Investment implications
It would be a mistake to construct an investment portfolio in anticipation of a single outcome of all the probabilities outlined in this analysis. There are too many moving parts to say with certainty what will happen, or when. As noted, concerns about debt and deficits are a perennial part of the investment landscape, and our successors might very well be writing and reading about these same topics decades hence.
We believe that portfolios are best constructed from the bottom up through individual security analysis and a determination of value. There are, however, some top-down portfolio implications that arise from this analysis.
As inflation is likely part of any economic path forward, investors should protect the purchasing power of their investments. Equities, broadly defined, offer more inflation protection than fixed income, particularly when an underlying company has the brand value, customer loyalty, and pricing power that allows it to raise prices. Furthermore, companies that disproportionately benefit from technology, or create technology solutions for other businesses, are well positioned to participate in and benefit from the productivity engine of future economic growth. Finally, international equities play an important role in well-balanced portfolios as well by broadening the investment selection set and offering exposure to currencies other than the U.S. dollar.
As inflation is likely part of any economic path forward, investors should protect the purchasing power of their investments.”
Fixed income continues to play an important role in most portfolios as well, offering a source of regular return, a ballast to the typical volatility of equity prices, and liquidity. But bonds – and government bonds, in particular – warrant close attention and analysis, as some of the solutions to our deficit and debt challenges pose implications for interest rates. Complacency in this asset class is dangerous, and careful and attentive analysis is a way to mitigate the downside risk of policy surprise.
Policy choices could present opportunities as well. If, for example, the government seeks to pursue revenue growth through higher taxes, the tax treatment of securities such as municipal bonds might make them more attractive. We believe that quality always matters in fixed income, and that fundamental analysis is mission critical in identifying this quality.
Nothing went right on June 6, 1944. As allied forces stormed the beaches at Normandy and air-dropped behind enemy lines, the winds blew in the wrong direction, heavy fog made landing difficult, and troops were separated and spread thin. After the war ended, Supreme Allied Commander Dwight Eisenhower was asked how the best military minds got so much wrong. Eisenhower admitted that the D-Day plans turned out to be almost worthless, but he was adamant that the planning won the war. It was, he claimed, the process that mattered most: The planning exercise created the adaptability and flexibility that won the day when circumstances changed in unpredictable ways.
We live in uncertain times. As with military planning, so with investment portfolios. You can’t precisely predict, but you can prepare.
Contact Us


1 “First Report on the Public Credit.” 1790. Alexander Hamilton. https://teachingamericanhistory.org/document/first-report-on-public-credit/
2 “United States of America Long-Term Rating Lowered to ‘AA+’ Due To Political Risks, Rising Debt Burden; Outlook Negative.” August 2011. Standard & Poor’s. https://www.spglobal.com/ratings/en/regulatory/article/-/view/type/HTML/id/883558
3 “Moody’s Ratings downgrades United States ratings to Aa1 from Aaa; changes outlook to stable.” May 2025. Moody’s Ratings. https://ratings.moodys.com/ratings-news/443154
4 Basis point (bp) is a unit that is equal to 1/100th of 1% and is used to denote the change in price or yield of a financial instrument.
5 "The Sun Also Rises.” 1926. Ernest Hemingway.
Opinions, forecasts, and discussions about investment strategies represent the author’s views as of the date of this commentary and are subject to change without notice.
Brown Brothers Harriman & Co. (“BBH”) may be used to reference the company as a whole and/or its various subsidiaries generally. This material and any products or services may be issued or provided in multiple jurisdictions by duly authorized and regulated subsidiaries. This material is for general information and reference purposes only and does not constitute legal, tax or investment advice and is not intended as an offer to sell, or a solicitation to buy securities, services or investment products. Any reference to tax matters is not intended to be used, and may not be used, for purposes of avoiding penalties under the U.S. Internal Revenue Code, or other applicable tax regimes, or for promotion, marketing or recommendation to third parties. All information has been obtained from sources believed to be reliable, but accuracy is not guaranteed, and reliance should not be placed on the information presented. This material may not be reproduced, copied or transmitted, or any of the content disclosed to third parties, without the permission of BBH. All trademarks and service marks included are the property of BBH or their respective owners. © Brown Brothers Harriman & Co. 2025. All rights reserved. PB-08765-2025-07-22