

Chart depicting the steepening yield curve as of 12/31/2024, 6/30/2025, and 9/30/2025.
Highlights
|
Q3 2025 Municipal Fixed Income Commentary
Patience
The first half of the year tested investors’ patience. The municipal market struggled from a threat to the tax-exempt treatment of its income, a deluge of new issuance, and concerns about large-scale federal fiscal deficits. Although returns were subdued, opportunities flourished. Since June, the municipal market has stormed back, rewarding those who stayed the course and took advantage of the historically attractive valuations. In early July, the passing of the One Big Beautiful Bill Act (OBBBA) removed a big threat, leaving municipal bonds tax-free. While we are grateful that municipals emerged unscathed from the OBBBA, new uncertainties have now emerged that may weaken the credit footing of healthcare providers, higher education, and states.
The Fed has been no stranger to managing through challenging times. At its September FOMC meeting, after holding firm and patiently balancing the risks of its dual mandate, the Fed eased its policy rate by 25 basis points (bps).1 The Fed has faced intense pressure and public scrutiny, as it manages an increasingly challenging landscape. Inflation remains elevated; the labor market has weakened; massive federal fiscal deficits have now become the new normal; and unknown tariff impacts linger. As we begin the final quarter of 2025, the government entered a shut-down, bringing new uncertainties. No one said it would be easy, but Chair Powell has found himself in an unenviable position. Market expectations currently reflect 100 bps of easing by the end of 2026, but the path ahead is unlikely to be smooth.
With the tax treatment of municipals resolved and the Fed back on an easing path, yields fell during the quarter, and the curve steepened. Inside of 5 years, yields declined roughly 40 bps – almost twice the drop for 10- to 20-year bonds. These declines fueled a 2.3% return for our 1- to 10-year intermediate benchmarks, their seventh-best quarter in 15 years. Year-to-date returns now stand at 4.1%. Despite the strong quarterly results, a substantial disparity remains in performance across maturities, with 5-year maturities generating a 400 bp advantage over long maturity bonds.
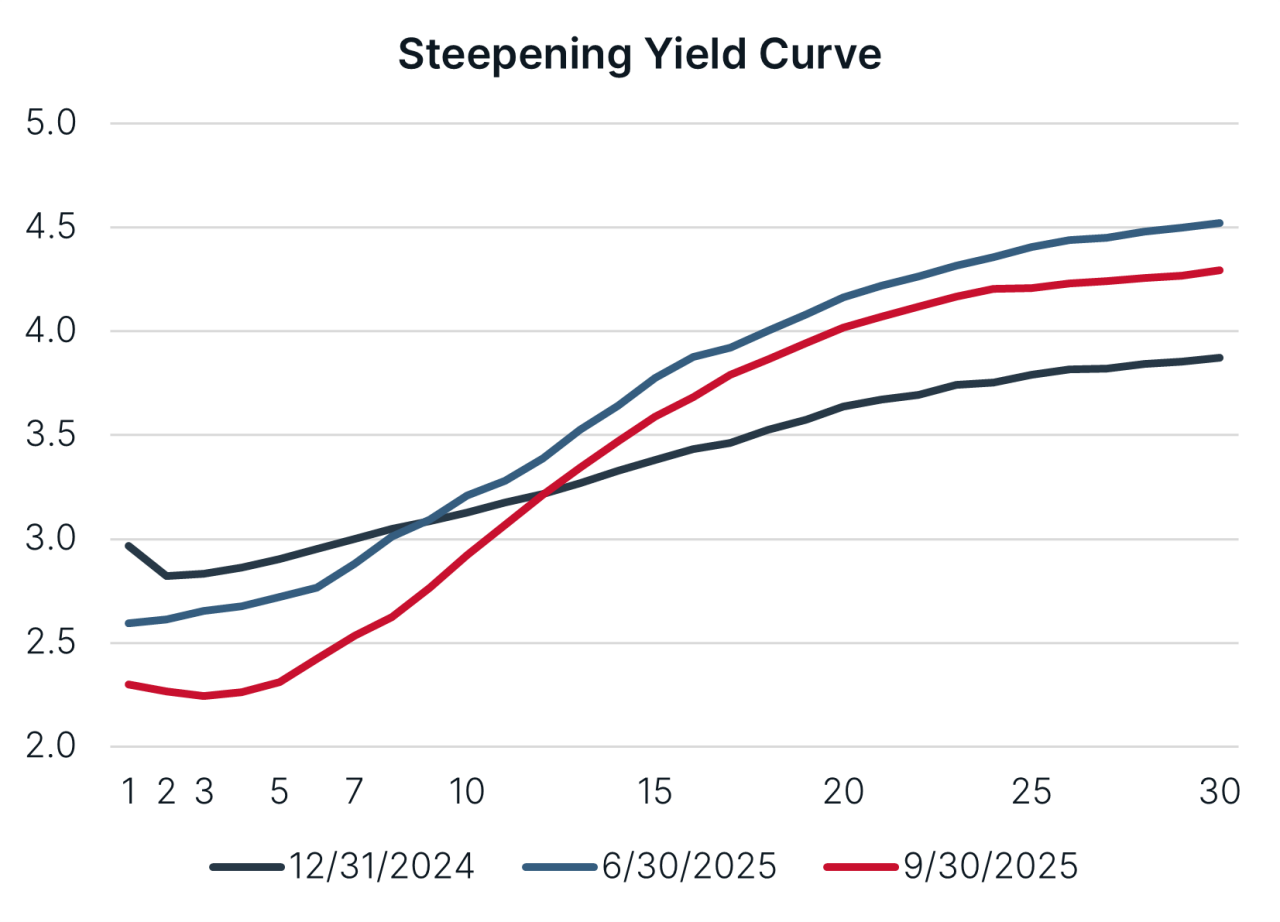
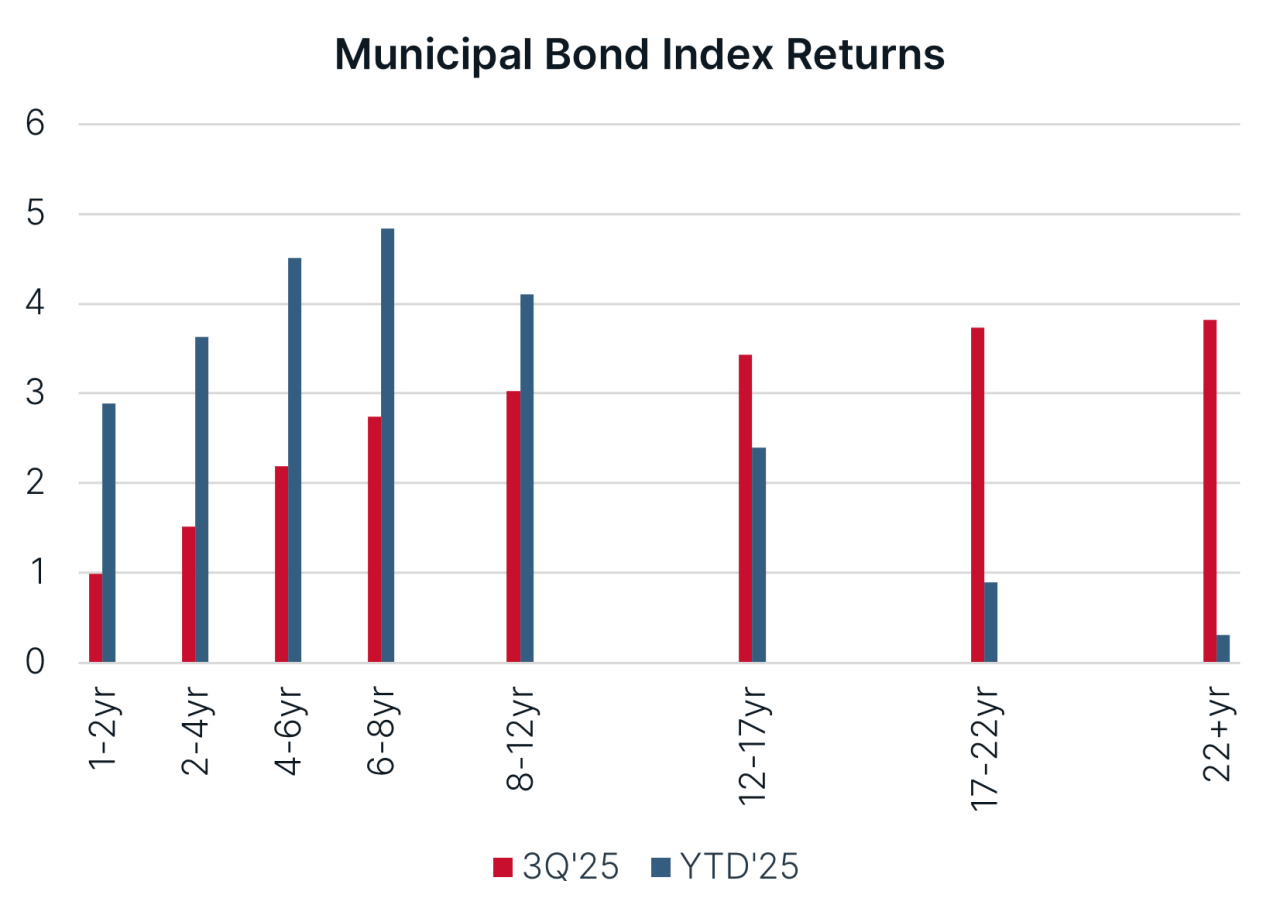
Chart depicting municipal bond index returns in Q3 2025 vs. YTD 2025.
In terms of portfolio performance, our accounts were flat-to-moderately ahead of their benchmarks, bringing relative year-to-date returns to roughly 50 bps ahead. Most of this benefit stems from our portfolios’ yield advantages which are driven by their housing, prepaid gas and energy, and airport exposures, as well as their holdings of bonds with non-standard coupon structures. Valuations in these areas are much more interesting, and we prefer them over seeking yield by simply moving down in credit quality.
For years, we have owned strategic allocations of floating-rate notes and zero-coupon bonds. Traditional municipal investors value stable cash flow from their bonds. In this regard, floating-rate notes and zero-coupon bonds lack the appeal of 5% coupon general obligation bonds, narrowing their buyer base. As a result, both floaters and zeros offer more yield than they should, often upward of 50 to 75 bps. Owning this combination of securities also allows us to bridge over short maturities which usually offer the lowest yields and tightest credit spreads across the curve. Our portfolios typically benefit from this positioning, but in quarters like 3Q 2025, when yields drop and the curve steepens in anticipation of easier monetary policy, this position can lag.
Record-paced new issuance has kept our opportunity set broad, even in the face of strong demand driven by positive investor sentiment during the quarter. Year-to-date supply is running 15% to 20% ahead of last year. In several of the subsectors in which we focus, the year-over-year change is even greater. As a result, we remained active during the quarter, adding opportunities in the housing, prepaid gas and energy, and airport sectors, which offer various advantages. For example, while our portfolios’ floaters and zeros may not produce the regular cash flows many investors seek, our housing bonds more than compensate for the gap. With spreads of 115 to 120 bps over generic Triple-A rated municipals, they continue to provide very attractive income relative to their quasi-government agency credit risk.
We also find attractive valuations in the prepaid gas and energy sector. Historically, this sector has been dominated by large banks as funding recipients, but increased sector diversification has brought in high-quality insurance companies. When municipal opportunities arise with embedded corporate risk, such as in this sector, we collaborate with our taxable fixed income colleagues. In the third quarter, we added a bond backed by New York Life at a spread of 100 bps.
The OBBBA made permanent certain provisions of the Tax Cuts and Jobs Act (TCJA) of 2017 with respect to the alternative minimum tax (AMT) which were due to sunset. Many municipal investors view the AMT with dread, but we often see income opportunities, like we did during the third quarter. The AMT represents a tax that can be applied to “private activity bonds,” which benefit private entities in addition to the public. Bonds that fund airports represent the largest sector of municipal bonds subject to the AMT. Today, the most common triggers for the AMT arise from exercising incentive stock options or recognizing extremely large capital gains. The TCJA reduced the footprint of the AMT down from 5 million taxpayers to 200,000, and the OBBBA permanently extended the AMT provisions of the TCJA. Still, despite the reduced footprint of the AMT, airport bonds subject to it continue to offer historically wide spreads relative to those that are not subject to it. During the quarter, we purchased a range of airport bonds, including Seattle, Orlando, and Houston, at spreads from 80 to 100 bps. While many investors may shun AMT bonds, we currently hold a meaningful exposure, benefiting from their attractive income and the extra return potential should the AMT spread decline over time.
The OBBBA also enacted tax and policy changes that will impact municipal credit across multiple sectors. States and localities will continue to face headwinds related to higher state and local tax (SALT) caps, reducing their effective flexibility to increase taxes. Hospitals and continuing care facilities will bear the brunt of cuts to Medicaid, as the OBBBA will implement work requirements for receiving Medicaid, cap increases on provider taxes, and cut funding by about $1 trillion over the next decade. In conjunction with tight labor markets for healthcare professionals and the recent $100,000 fee for new H-1B visa petitions, the healthcare sector will face significant challenges. Smaller rural and safety net systems face more acute risks. Higher education institutions will also be impacted, although to a lesser extent than previously expected. Higher education received a modest increase in the endowment tax, which depends on asset levels, and a significant curtailment to federal student loan programs, which could limit accessibility to higher education for low- to moderate-income students. We expect smaller, liberal arts-focused institutions to continue to struggle from secular headwinds.
Patience is a virtue and a necessity for effective long-term investing. Patience is key to managing through periods of market turmoil, to saying “no” a lot during periods of exuberance, and to staying selective when evaluating market opportunities. This year has thrown its share of curveballs, testing our mettle, strategy, and team. The municipal market remains attractive with elevated long-term yields, a steep yield curve, and record supply. Although investor sentiment has improved and yields have fallen since the spring, good values are out there; we just need to look a little harder. A volatile future is shaping up, and we will need more than just a little patience.

| Performance As of September 30, 2025 |
|||||||
|---|---|---|---|---|---|---|---|
|
Total Returns |
Average Annual Total Returns |
|||||
Composite/Benchmark |
3 Mo. |
YTD |
1 Yr. |
3 Yr. |
5 Yr. |
10 Yr. | Since Inception |
BBH Municipal Fixed Income Composite (gross of fees) |
2.63% |
4.34% |
3.51% |
5.76% |
1.85% |
2.89% |
3.70% |
BBH Municipal Fixed Income Composite (net of fees) |
2.57% |
4.15% |
3.25% |
5.50% |
1.60% |
2.64% |
3.44% |
Bloomberg Municipal Index 1-10 Yr Blend (1-12) |
2.33% |
4.13% |
3.14% |
4.26% |
1.21% |
2.06% |
3.22% |
Returns of less than one year are not annualized. Inception date: 05/01/2002. |
|||||||
| Past performance does not guarantee future results. Sources: BBH & Co and Bloomberg | |||||||
| Representative Account Top 10 Obligors As of September 30, 2025 |
|
|---|---|
Texas School Bond Guarantee Program |
3.2% |
Baylor Scott & White Health, TX |
2.6% |
South Carolina Mortgage Revenue Bonds |
2.6% |
Port of Seattle - GARBS and PFCS |
2.4% |
Texas Department of Housing and Community Affairs Single Family Mortgage Revenue Bonds |
2.2% |
Houston Airport Enterprise, TX |
2.2% |
llinois Housing Development Authority |
2.2% |
Los Angeles Department of Water & Power, CA |
2.1% |
Nebraska Investment Finance Authority |
2.1% |
Salt Verde Financial Corporation |
2.1% |
Total |
23.7% |
| Sources: Bloomberg and BBH | |
1 Basis point (bp) is a unit that is equal to 1/100th of 1% and is used to denote the change in price or yield of a financial instrument.
There is no assurance that a portfolio will achieve its investment objective or that the strategy will work under all market conditions. The value of the portfolio can be affected by changes in interest rates, general market conditions and other political, social and economic developments. Each investor should evaluate their ability to invest for the long-term, especially during periods of downturn in the market.
Investing in the bond market is subject to certain risks including market, interest-rate, issuer, credit, maturity, call and inflation risk; investments may be worth more or less than the original cost when redeemed.
Income from municipal bonds may be subject to state and local taxes and at times the alternative minimum tax.
The Strategy also invests in derivative instruments, investments whose values depend on the performance of the underlying security, assets, interest rate, index or currency and entail potentially higher volatility and risk of loss compared to traditional stock or bond investments.
As the Strategy’s exposure in any one municipal revenue sector backed by revenues from similar types of projects increases, the Strategy will become more sensitive to adverse economic, business or political developments relevant to these projects.
The Representative Account is managed with the same investment objectives and employs substantially the same investment philosophy and processes as the strategy.
The objective of our Municipal Fixed Income Strategy is to deliver excellent after-tax returns in excess of industry benchmarks through market cycles. The Composite includes all fully discretionary fee-paying municipal fixed income accounts with an initial investment equal to or greater than $5 million that are managed to an average duration of approximately 4.5 years. Portfolios that subsequently fall below $4.5 million are excluded from the Composite.
Bloomberg 1-10 Year Municipal Bond Index is a component of the Bloomberg Municipal Bond index, including bonds with maturity dates between one and 17 years. The Bloomberg Municipal Bond Index is considered representative of the broad market for investment grade, tax-exempt bonds with a maturity of at least one year. One cannot invest directly in an index.
Bloomberg US Aggregate Bond Index is a market value-weighted index that tracks the daily price, coupon, pay-downs, and total return performance of fixed-rate, publicly placed, dollar-denominated, and non-convertible investment grade debt issues with at least $300 million par amount outstanding and with at least one year to final maturity.
Bloomberg US Corporate Bond Index measures the investment grade, fixed-rate, taxable corporate bond market. It includes USD-denominated securities publicly issued by US and non-US industrial, utility and financial issuers. The Index is a component of the US Credit and US Aggregate Indices. “Bloomberg®” and the
Bloomberg 1-10 Year Municipal Bond Index are service marks of Bloomberg Finance L.P. and its affiliates, including Bloomberg Index Services Limited (“BISL”), the administrator of the index (collectively, “Bloomberg”) and have been licensed for use for certain purposes by Brown Brothers Harriman & Co (BBH).
Bloomberg is not affiliated with BBH, and Bloomberg does not approve, endorse, review, or recommend the BBH Strategy. Bloomberg does not guarantee the timeliness, accurateness, or completeness of any data or information relating to the fund.
Brown Brothers Harriman Investment Management (“IM”), a division of Brown Brothers Harriman & Co (“BBH”), claims compliance with the Global Investment Performance Standards (GIPS®). GIPS® is a registered trademark of CFA Institute. CFA Institute does not endorse or promote this organization, nor does it warrant the accuracy or quality of the content contained herein. To receive additional information regarding IM, including a GIPS Composite Report for the strategy, contact John Ackler at 212 493-8247 or via email at john.ackler@bbh.com.
Gross of fee performance results for this composite do not reflect the deduction of investment advisory fees. Actual returns will be reduced by such fees. “Net” of fees performance results reflect the deduction of the maximum investment advisory fees. Returns include all dividends and interest, other income, realized and unrealized gain, are net of all brokerage commissions, execution costs, and without provision for federal or state income taxes. Results will vary among client accounts. Performance calculated in U.S. dollars.
Holdings are subject to change.
Credits: Obligations such as bonds, notes, loans, leases and other forms of indebtedness, except for Cash and Cash Equivalents, issued by obligors other than the U.S. Government and its agencies, totaled at the level of the ultimate obligor or guarantor of the Obligation. Issuers with credit ratings of AA or better are considered to be of high credit quality, with little risk of issuer failure. Issuers with credit ratings of BBB or better are considered to be of good credit quality, with adequate capacity to meet financial commitments. Issuers with credit ratings below BBB are considered speculative in nature and are vulnerable to the possibility of issuer failure or business interruption.
Opinions, forecasts, and discussions about investment strategies represent the author’s views as of the date of this commentary and are subject to change without notice. References to specific securities, are for illustrative purposes only and are not intended to be, and should not be interpreted as recommendations.
Brown Brothers Harriman & Co. (“BBH”) may be used to reference the company as a whole and/or its various subsidiaries generally. This material and any products or services may be issued or provided in multiple jurisdictions by duly authorized and regulated subsidiaries. This material is for general information and reference purposes only and does not constitute legal, tax or investment advice and is not intended as an offer to sell, or a solicitation to buy securities, services or investment products. Any reference to tax matters is not intended to be used, and may not be used, for purposes of avoiding penalties under the U.S. Internal Revenue Code, or other applicable tax regimes, or for promotion, marketing or recommendation to third parties. All information has been obtained from sources believed to be reliable, but accuracy is not guaranteed, and reliance should not be placed on the information presented. This material may not be reproduced, copied or transmitted, or any of the content disclosed to third parties, without the permission of BBH. All trademarks and service marks included are the property of BBH or their respective owners. © Brown Brothers Harriman & Co. 2025. All rights reserved. M-16840-2025-07-09
NOT FDIC INSURED NO BANK GUARANTEE MAY LOSE MONEY