


Performance |
|||||||
|---|---|---|---|---|---|---|---|
|
Total Returns |
Average Annual Total Returns |
|||||
Composite/Benchmark |
3 Mo. |
YTD |
1 Yr. |
3 Yr. |
5 Yr. |
10 Yr. | Since Inception |
BBH Core Plus Fixed Income Composite (Gross of Fees) |
1.96% |
4.87% |
7.74% |
5.26% |
2.27% |
4.25% |
6.31% |
BBH Core Plus Fixed Income Composite (Net of Fees) |
1.89% |
4.74% |
7.47% |
5.00% |
2.02% |
3.99% |
6.05% |
Bloomberg US Aggregate Bond Index |
1.20% |
4.02% |
6.07% |
2.55% |
-0.73% |
1.76% |
5.53% |
Past performance does not guarantee future results. Strategy Inception: 01/01/1986 Returns of less than one year are not annualized. |
|||||||
| The Bloomberg US Aggregate Bond Index is comprised of U.S. dollar-denominated investment grade fixed income securities with maturities of at least one year. The index includes corporate, government, and mortgage-backed securities. One cannot invest directly in an index. Sources: Bloomberg and BBH & Co. | |||||||
Highlights
|
Market Environment
“In like a lion, out like a lamb” is an apt metaphor for capital markets in the second quarter. On April 2, 2025, the roar of Liberation Day tariffs rattled global markets. However, President Trump subsequently reduced the proposed tariff levels and markets rebounded strongly. A steady stream of notable headlines followed, including, but not limited to, the Moody’s U.S. downgrade, questions about the Federal Reserve’s independence, the One Big Beautiful Bill (OBBB) Act and its impact to the U.S. fiscal deficit, and rising tensions in the Middle East. Despite the deluge of news, the quarter ended with economic and market data seemingly unconcerned with those headlines. Equities posted strong returns during the quarter, while credit performed well as spreads narrowed back to recent lows. Unemployment and inflation data remained steady, and business and consumer sentiment improved from Liberation Day lows. Market predictions shifted to a higher-for-longer Fed stance.
The second quarter showed why interest rate timing is a challenging undertaking. The yield curve both inverted further from zero to three years and steepened from three to 30 years as uncertainties regarding Fed rate cuts, inflation, and growth persisted. The next Fed decision is scheduled for July 30, 2025. Investors predict the Fed will not cut rates then, with mixed opinions on whether the Fed cuts rates at all during the third quarter.
Fixed income indexes enjoyed positive total and excess returns during the quarter. Riskier segments of the market outperformed higher-quality indexes as credit spreads narrowed. The Bloomberg Aggregate Index returned 1.2%, while the JPM Leveraged Loan Index returned 2.4% and the Bloomberg High Yield Index returned 3.5%.
Credit issuance was mixed during the quarter despite a lull of deals during the depths of market volatility in April. Investment-grade corporate bond issuance matched last year’s pace, while private label commercial mortgage-backed securities (CMBS) volumes are up 61% year over year. Issuance in several sectors was lower than their record-setting paces of 2024, yet volumes did not crater, and high-quality issuers can continue to access the markets. Volumes of nontraditional asset-backed securities (ABS), high-yield corporate bonds, and loans were down 9%, 15%, and 37%, respectively, year over year.
Credit dynamics are generally healthy, with losses and delinquencies of business loans, consumer debt, and commercial real estate loans generally at manageable levels. Businesses have weathered recent uncertainties well. Default rates are lower across the high-yield market, although the default rate on loans continues to be well above those for bonds. Delinquencies and charge-off rates of business loans at commercial banks have stabilized, and non-accrual rates of loans held by business development companies (BDCs) crept higher yet remain at manageable levels.
Delinquency rates and charge-offs on consumer loans held at commercial banks increased, yet not to levels that raise concerns about systemic losses that might impact securitizations. While auto loans, bank credit cards, and mortgage delinquencies have only modestly increased, federal student loan payments resumed during the quarter, causing a spike in delinquency rates on student loans. It is questionable whether the resumption of student loan payments will have a spillover effect into other types of consumers’ debt. Strong credit underwriting remains imperative to navigating debts backed by or tied to consumers.
Delinquency rates on commercial real estate varied by sectors and deal structures. Office delinquencies revealed a divergence by deal structure: Office loans in conduits continued to rise while single-asset, single-borrower (SASB) delinquencies moderated. Multifamily delinquencies increased to recent highs across deal structures. In retail, hotel, and industrial sectors, SASB and conduit delinquency rates converged at similar levels quarter over quarter. Delinquency rates and charge-offs of commercial real estate loans held at commercial banks remain subdued, indicating that market stress has not impacted banks’ credit portfolios to date.
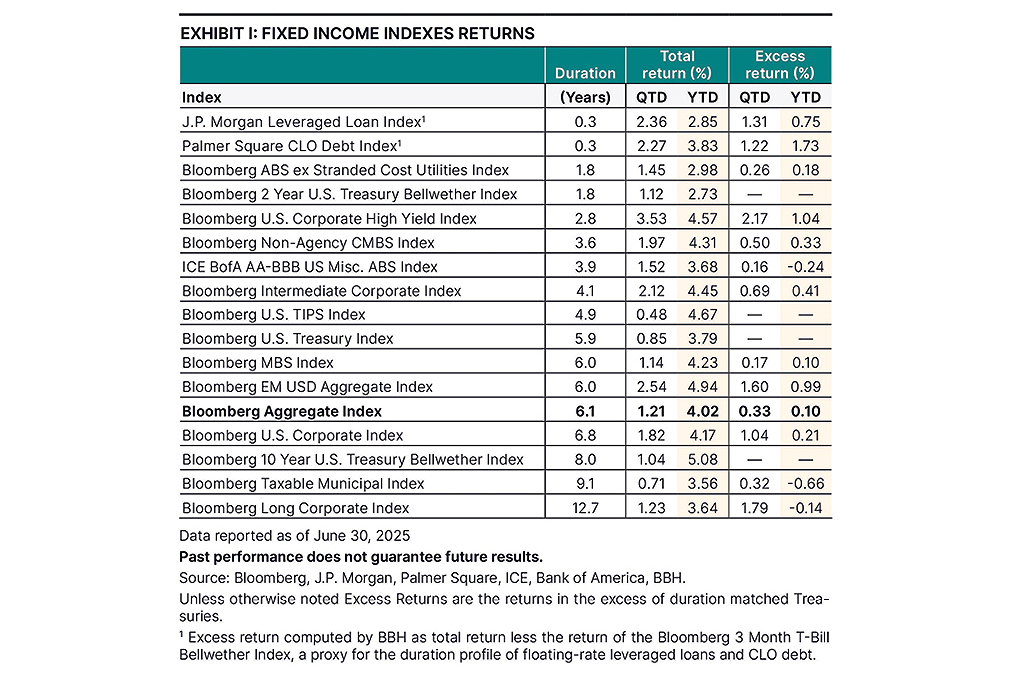
Exhibit I: Fixed income index returns for various indexes as of June 30, 2025, displaying duration, total return, and excess return.
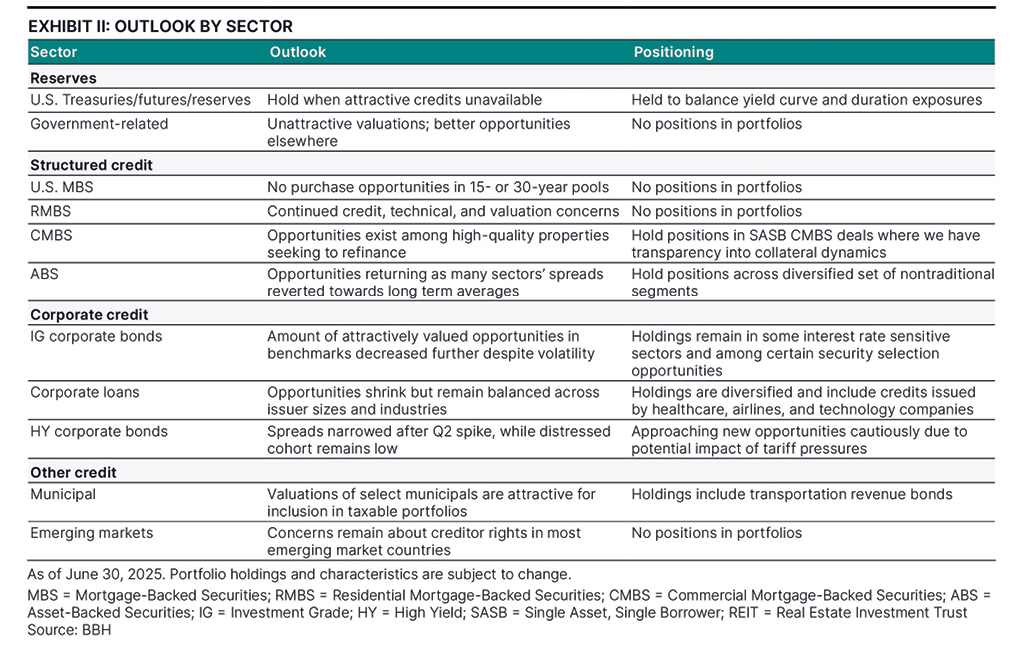
Valuations
With narrower spreads, strong fixed income fund flows, and mixed issuance, credit valuations weakened during the quarter. Investment-grade corporate bond “buys” decreased to 8% from 11%, to 27% from 38% for high yield, and to 43% from 45% for loans. Agency mortgage-backed securities (MBS) remain wholly unattractive, with no 15- or 30-year coupon cohort screening as a “buy.” Away from credits in mainstream indexes, ABS index spreads narrowed, though performance varied by subsector. Higher-quality CMBS spreads narrowed as spreads of BBB- rated multifamily and mixed-use CMBS widened. Spreads on collateralized loan obligation (CLO) debt narrowed further from already tight levels.
As always, there are idiosyncratic opportunities in distinct corners of the credit markets. Investment-grade corporate bonds in interest rate-sensitive industries offer opportunities, and many bonds with short to intermediate durations screen favorably. The corporate loan market continues to offer opportunities across the spectrum of deal sizes. Most high-yield opportunities reside in selective and smaller issuers. Tariffs and fiscal policy uncertainty have also affected several high-yield industries’ valuations and created opportunities. Spreads of several ABS subsectors and SASB CMBS property types have moved near their long-term averages.
We continue to avoid certain segments that we believe have enduring credit issues. Emerging market credit remains unappealing to us due to concerns over creditor rights in most countries and its impact on their durability. We find non-agency residential mortgage-backed securities (RMBS) plagued by erratic issuance trends, unattractive valuations, and weak fundamentals.
Performance
The portfolio outperformed its benchmark during the quarter, with selection effects driving performance. Sector effects had minimal contribution compared to selection, and rate effects had a small negative impact. ABS, investment-grade corporate bonds, loans, and high-yield corporate bonds had favorable and strong selection effects. Positions in cable satellite loans, insurance-linked ABS, and healthcare loans were subsectors that contributed the most. Our avoidance of agency MBS had negative but minimal detraction from performance. Loans to chemical companies detracted modestly from selection effects.
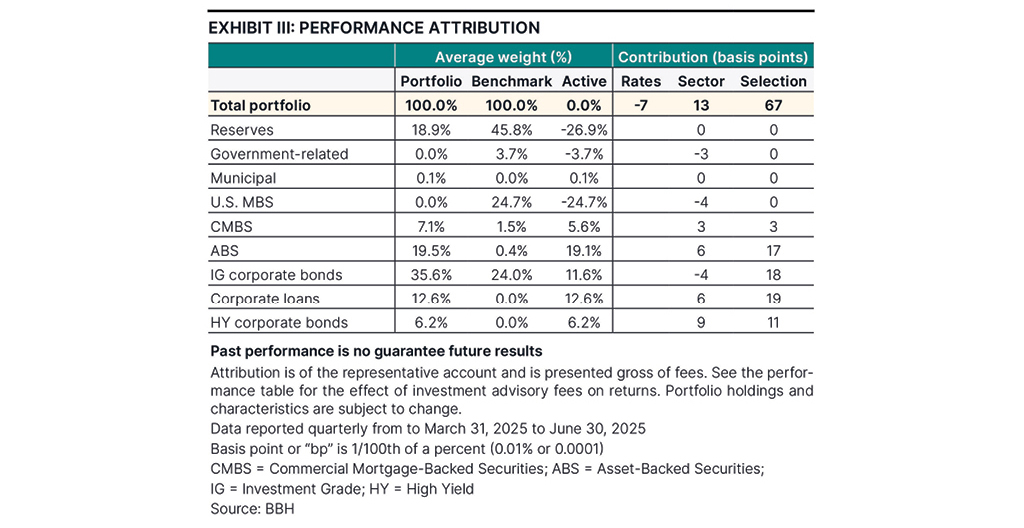
Exhibit III: Attribution as of June 30, 2025, showing average portfolio weight and gross contribution displayed in basis points.
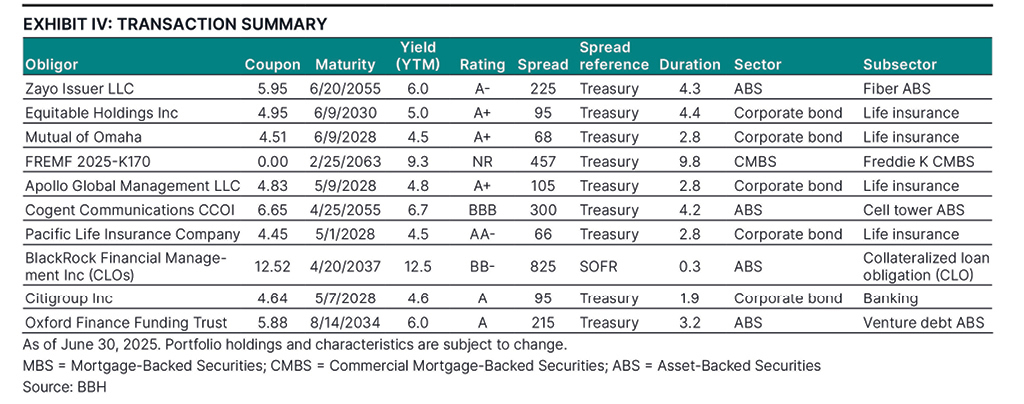
Transaction Summary
We continued to find durable credits1 offering attractive value even as valuations are broadly unattractive. The table below summarizes a few notable portfolio additions.
Characteristics
The portfolio had a lower spread duration than the benchmark, reflecting less sensitivity to changes in credit spreads. Spread duration and effective duration only slightly increased quarter over quarter. Over the quarter, holdings of corporate bonds increased while holdings across all other sectors decreased. The portfolio held no exposure to agency MBS due to valuation concerns. The fund held 18% in high-yield and nonrated credit instruments, similar to last quarter’s level.
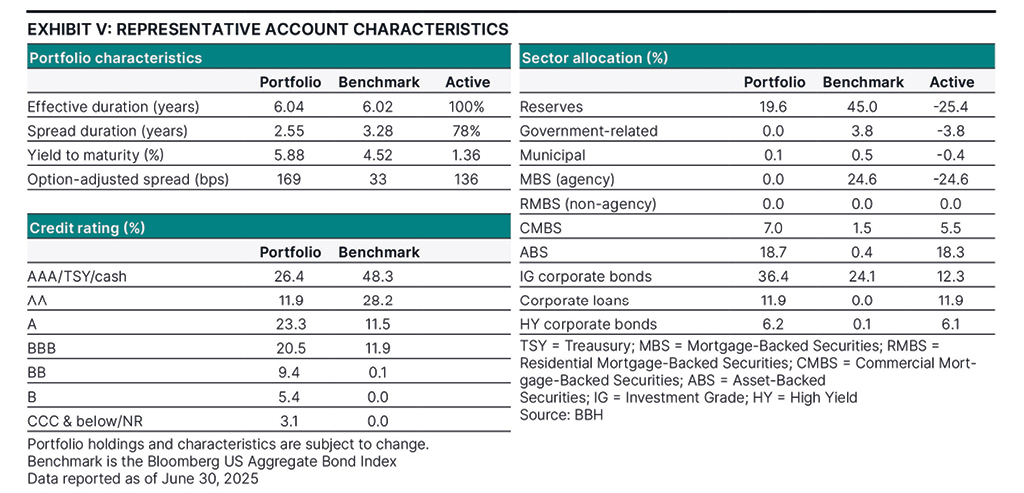
Exhibit V: Characteristics as of June 30, 2025, including credit rating and sector allocation.
Concluding Remarks
If you could go back in time to last fall and show an investor this quarter’s headlines, we suspect they would be shocked by the buoyancy of the stock market and rich valuations of credit. We believe that selectivity regarding both valuations and durability are imperative for attaining favorable credit performance moving forward. Complacency may be creeping into some segments of the market, but we remain steadfast in our approach. We maintain attention to factors that underlie an issuer’s durability, such as underwriting standards, financial and operating flexibility, and prudent capital structures. Such an approach helps our clients’ portfolios perform through unpredictable times.


1 Obligations such as bonds, notes, loans, leases, and other forms of indebtedness, except for cash and cash equivalents, issued by obligors other than the U.S. Government and its agencies, totaled at the level of the ultimate obligor or guarantor of the Obligation. Durable means the ability to withstand a wide variety of economic conditions
Totals may not sum due to rounding.
The securities do not represent all of the securities purchased, sold, or recommended for advisory clients and you should not assume that investments in the securities were or will be profitable.
Issuers with credit ratings of AA or better are considered to be of high credit quality, with little risk of issuer failure. Issuers with credit ratings of BBB or better are considered to be of good credit quality, with adequate capacity to meet financial commitments. Issuers with credit ratings below BBB are considered speculative in nature and are vulnerable to the possibility of issuer failure or business interruption.
Purchase and sale information provided should not be considered as a recommendation to purchase or sell a particular security and that there is no assurance, as of the date of publication, that the securities purchased remain in a portfolio or that securities sold have not been repurchased.
Opinions, forecasts, and discussions about investment strategies are as of the date of this commentary and are subject to change without notice. References to specific securities, asset classes, and financial markets are not intended to be and should not be interpreted as recommendations.
Definitions
Bloomberg US Aggregate Bond Index is a market value-weighted index that tracks the daily price, coupon, pay-downs, and total return performance of fixed-rate, publicly placed, dollar denominated, and non-convertible investment grade debt issues with at least $300 million paramount outstanding and with at least one year to final maturity The index is not available for direct investment.
Duration is a measure of the portfolio’s return sensitivity to changes in interest rates.
An index is not available for direct investment
“Bloomberg®” and the Bloomberg indexes are service marks of Bloomberg Finance L.P. and its affiliates, including Bloomberg Index Services Limited (“BISL”), the administrator of the indexes (collectively, “Bloomberg”) and have been licensed for use for certain purposes by Brown Brothers Harriman & Co (BBH). Bloomberg is not affiliated with BBH, and Bloomberg does not approve, endorse, review, or recommend the Strategy. Bloomberg does not guarantee the timeliness, accurateness, or completeness of any data or information relating to the Strategy.
Risks
Investors should be able to withstand short-term fluctuations in fixed income markets in return for potentially higher returns over the long term. The value of portfolios changes every day and can be affected by changes in interest rates, general market conditions, and other political, social, and economic developments.
Asset-Backed Securities (“ABS”) are subject to risks due to defaults by the borrowers; failure of the issuer or servicer to perform; the variability in cash flows due to amortization or acceleration features; changes in interest rates which may influence the prepayments of the underlying securities; misrepresentation of asset quality, value or inadequate controls over disbursements and receipts; and the ABS being structured in ways that give certain investors less credit risk protection than others. Below investment grade bonds, commonly known as junk bonds, are subject to a high level of credit and market risks.
SASB lacks the diversification of a transaction backed by multiple loans since performance is concentrated in one commercial property. SASBs may be less liquid in the secondary market than loans backed by multiple commercial properties.
The Strategy invests in derivative instruments, investments whose values depend on the performance of the underlying security, assets, interest rate, index or currency and entail potentially higher volatility and risk of loss compared to traditional bond investments.
Foreign investing involves special risks including currency risk, increased volatility, political risks, and differences in auditing and other financial standards. Prices of emerging market securities can be significantly more volatile than the prices of securities in developed countries, and currency risk and political risks are accentuated in emerging markets.
The Strategy may engage in certain investment activities that involve the use of leverage, which may magnify losses.
A significant investment of assets in one or more sectors, industries, securities and/or durations may increase its vulnerability to any single economic, political, or regulatory developments, which will have a greater impact on returns. Illiquid investments subject the investor to the risk that she may not be able to sell the investments when desired or at favorable prices.
Portfolio Characteristics are of the Representative Account. The Representative Account is managed with the same investment objectives and employs substantially the same investment philosophy and processes as the Strategy.
One basis point or bp is 1/100th of a percent (0.01% or 0.0001).
Brown Brothers Harriman Investment Management (“IM”), a division of Brown Brothers Harriman & Co (“BBH”), claims compliance with the Global Investment Per¬formance Standards (GIPS®). GIPS® is a registered trademark of CFA Institute. CFA Institute does not endorse or promote this organization, nor does it warrant the accuracy or quality of the content contained herein.
To receive additional information regarding IM, including a GIPS Composite Report for the strategy, contact John W. Ackler at 212 493-8247 or via email at john.ackler@bbh.com.
Gross of fee performance results for this composite do not reflect the deduction of investment advisory fees. Actual returns will be reduced by such fees. Net of fees performance results reflects the deduction of the maximum investment advisory fees. Returns include all dividends and interest, other income, realized and unrealized gain, are net of all brokerage commissions, execution costs, and without provision for federal or state income taxes. Results will vary among client accounts. Perfor¬mance calculated in U.S. dollars.
The objective of our Core Plus Fixed Income Strategy is to deliver excellent after-tax returns in excess of industry benchmarks through market cycles. The Representative Account is managed with the same investment objectives and employs substantially the same investment philosophy and processes as the strategy. The Composite included all fully discretionary, fee-paying core fixed income accounts over $10 million that are managed to a duration of approximately 4.5 years and are invested in a broad range of taxable bonds. Accounts that subsequently fall below $9.25 million are excluded from the Composite.
Brown Brothers Harriman & Co. (“BBH”) may be used to reference the company as a whole and/or its various subsidiaries generally. This material and any products or services may be issued or provided in multiple jurisdictions by duly authorized and regulated subsidiaries. This material is for general information and reference purposes only and does not constitute legal, tax or investment advice and is not intended as an offer to sell, or a solicitation to buy securities, services or investment products. Any reference to tax matters is not intended to be used, and may not be used, for purposes of avoiding penalties under the U.S. Internal Revenue Code, or other applicable tax regimes, or for promotion, marketing or recommendation to third parties. All information has been obtained from sources believed to be reliable, but accuracy is not guaranteed, and reliance should not be placed on the information presented. This material may not be reproduced, copied or transmitted, or any of the content disclosed to third parties, without the permission of BBH. All trademarks and service marks included are the property of BBH or their respective owners. © Brown Brothers Harriman & Co. 2025. All rights reserved.
Not FDIC Insured No Bank Guarantee May Lose Money
IM-16925-2025-07-21 Exp. Date 10/31/2025