Partnering with you to help preserve and grow your capital over the long term
We are committed to generating attractive risk-adjusted returns over full economic cycles in alignment with your goals. As active managers, we build concentrated portfolios with high active shares and low turnover, and have a long-term ownership mentality.
Our approach is founded on four key insights:
- Market prices can materially diverge from underlying business value, providing us with significant opportunities.
- Owning exceptionally high-quality, durable, growing businesses allows for disciplined decision-making in the face of economic challenges.
- Equity investing is business ownership, in our view, reflecting the compounding of underlying business value over long periods of time.
- We view risk as the permanent loss of capital and seek to invest in companies with both the fundamentals to manage downside risk, and that offer a margin of safety in terms of valuation.1
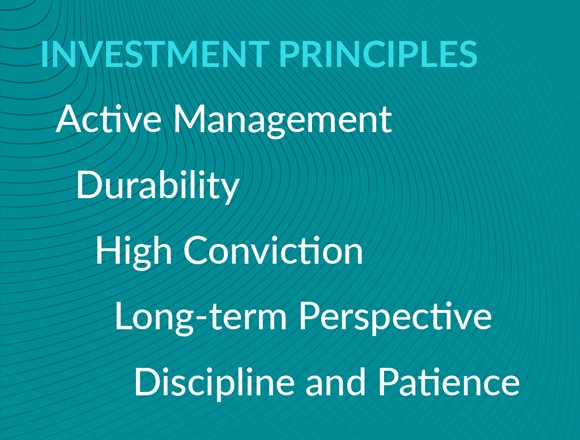
- Investment Principles
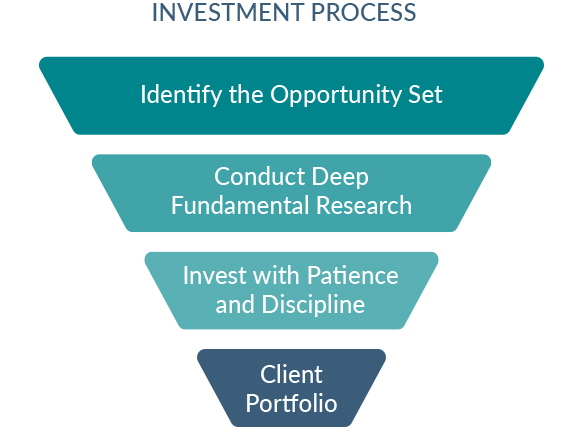
- Investment Process
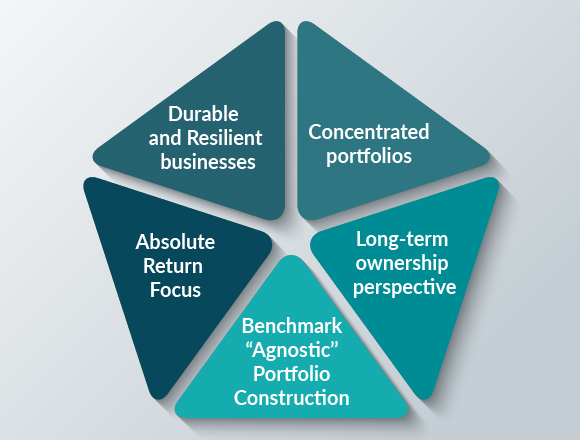
- What Makes Us Different?

Public Equity Strategies
How to Invest
Our investment strategies can be accessed through separately managed accounts (SMAs), mutual funds, UCITS funds, and private funds. To learn more please contact a member of our institutional relationship management team.
Visit the BBH Funds website and the BBH Luxembourg Funds website for more information about our public fund offerings.


BBH U.S. Large Cap Equity – Core Select is formerly U.S. Large Cap Equity.
1 A margin of safety exists when we believe there is a significant discount to intrinsic value at the time of the purchase. Intrinsic value is an estimate of the present value of the cash that a business can generate over its remaining life.
This communication is for informational purposes only and does not constitute an offer or a solicitation to buy or sell any particular security or to adopt any specific investment strategy. The information herein has not been based on a consideration of any individual investor’s circumstances and is not investment advice, nor should it be construed in any way as tax, accounting, legal or regulatory advice. Any views and opinions are subject to change at any time.
This material does not constitute an offer or solicitation in any jurisdiction where or to any person to whom it would be unauthorized or unlawful to do so.
Strategies are shown without regard to whether they are offered as separately managed account mandates or through pooled vehicles. Any discussion of or reference to any given strategy herein should not be taken as a recommendation or solicitation of any pooled vehicle which has an investment objective featuring or similar to such strategy.
The Public Equity strategies may assume large positions in a small number of issuers which can increase the potential for greater price fluctuation.
There is no assurance the strategies will achieve their investment objective or that the strategies will work under all market conditions. Each investor should evaluate their ability to invest for the long-term, especially during periods of downturn in the market.
The value of the portfolios can be affected by changes in interest rates, general market conditions and other political, social and economic developments.
Investment Advisory Products and Services:
NOT FDIC INSURED NO BANK GUARANTEE MAY LOSE VALUE