

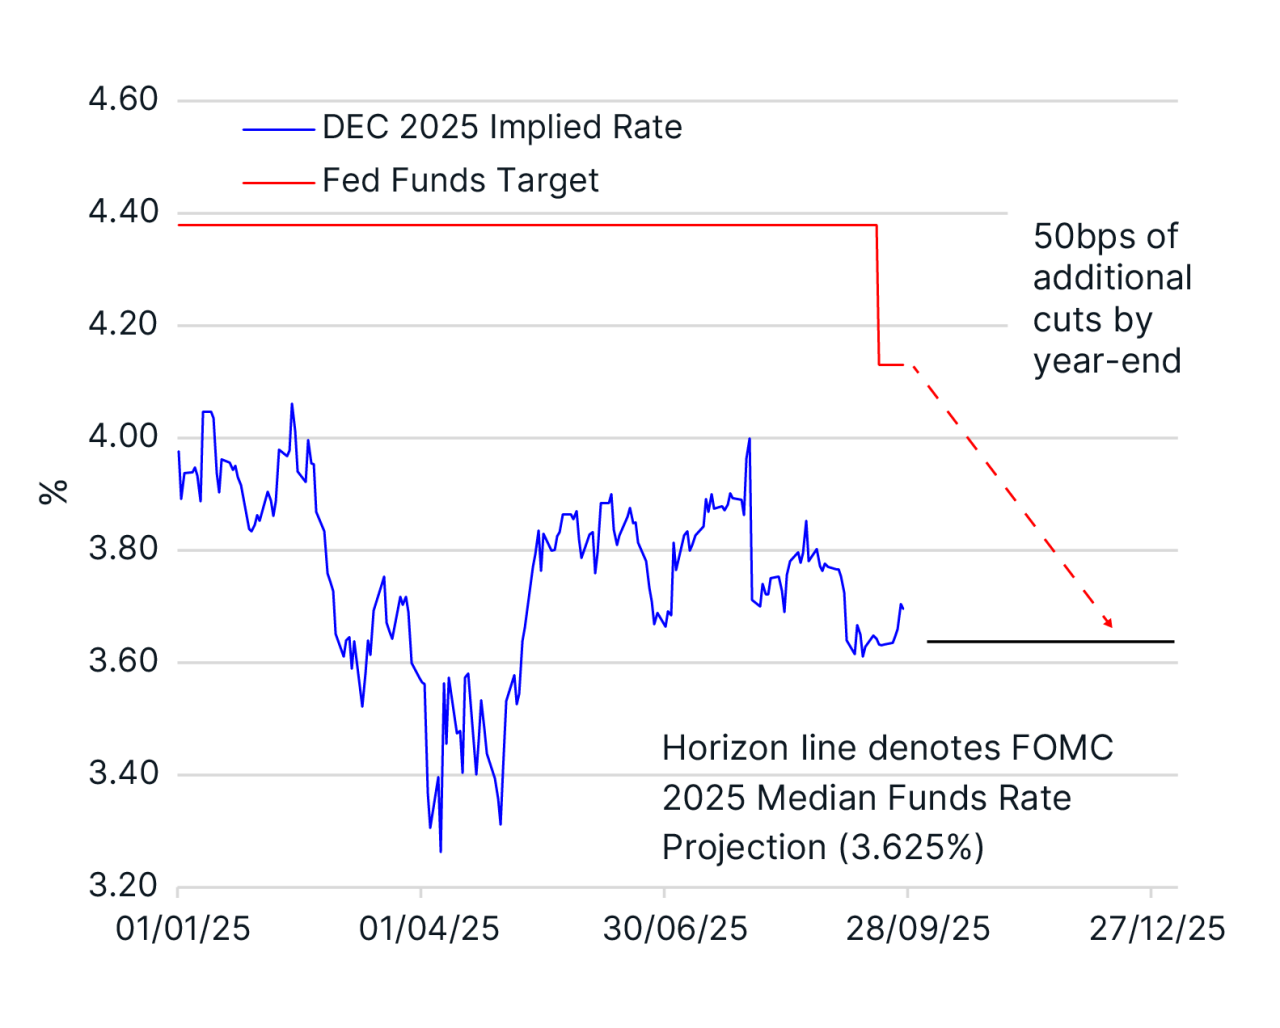
A line chart showing daily values from January 1, 2025, to September 26, 2025. The chart tracks two series: one fluctuating between approximately 3.3 and 4.4, and another fixed at 4.38 until mid-September, then at 4.13. The x-axis displays dates, and the y-axis shows numeric values. The chart ends on September 26, 2025.
At the September meeting, the US Federal Reserve (Fed) opted for a “risk-management cut”, not a sharp policy unwind.
As was widely expected, the Federal Open Market Committee (FOMC) cut the target range for the Fed funds rate 25bps to 4.00-4.25% after keeping them on hold since January. The biggest dovish take from the FOMC was that “The Committee…judges that downside risks to employment have risen.” This suggests more easing is expected if the US labor market shows ongoing weakness.
Indeed, the updated FOMC 2025 median Fed funds rate projection implies two more 25bps rate reductions by year-end to a target range of 3.50-3.75% (3.625%), largely in line with futures pricing (Chart 1). Unsurprisingly, there was one dissent in favor of a 50bps cut (Fed Governor Stephen Miran) and no dissent for keeping rates unchanged.
Everything else points to a shallow, gradual easing cycle. Firstly, the FOMC median funds rate projection still implies one cut in both 2026 and 2027 and the longer run rate is unchanged at 3.0%. Secondly, real GDP growth was revised higher across the forecast horizon, the unemployment rate was adjusted a tick lower for 2026 and 2027, and inflation was tweaked two ticks higher for 2026 (Chart 2). Thirdly, Fed Chair Jay Powell sounded cautious on the scope for further easing.
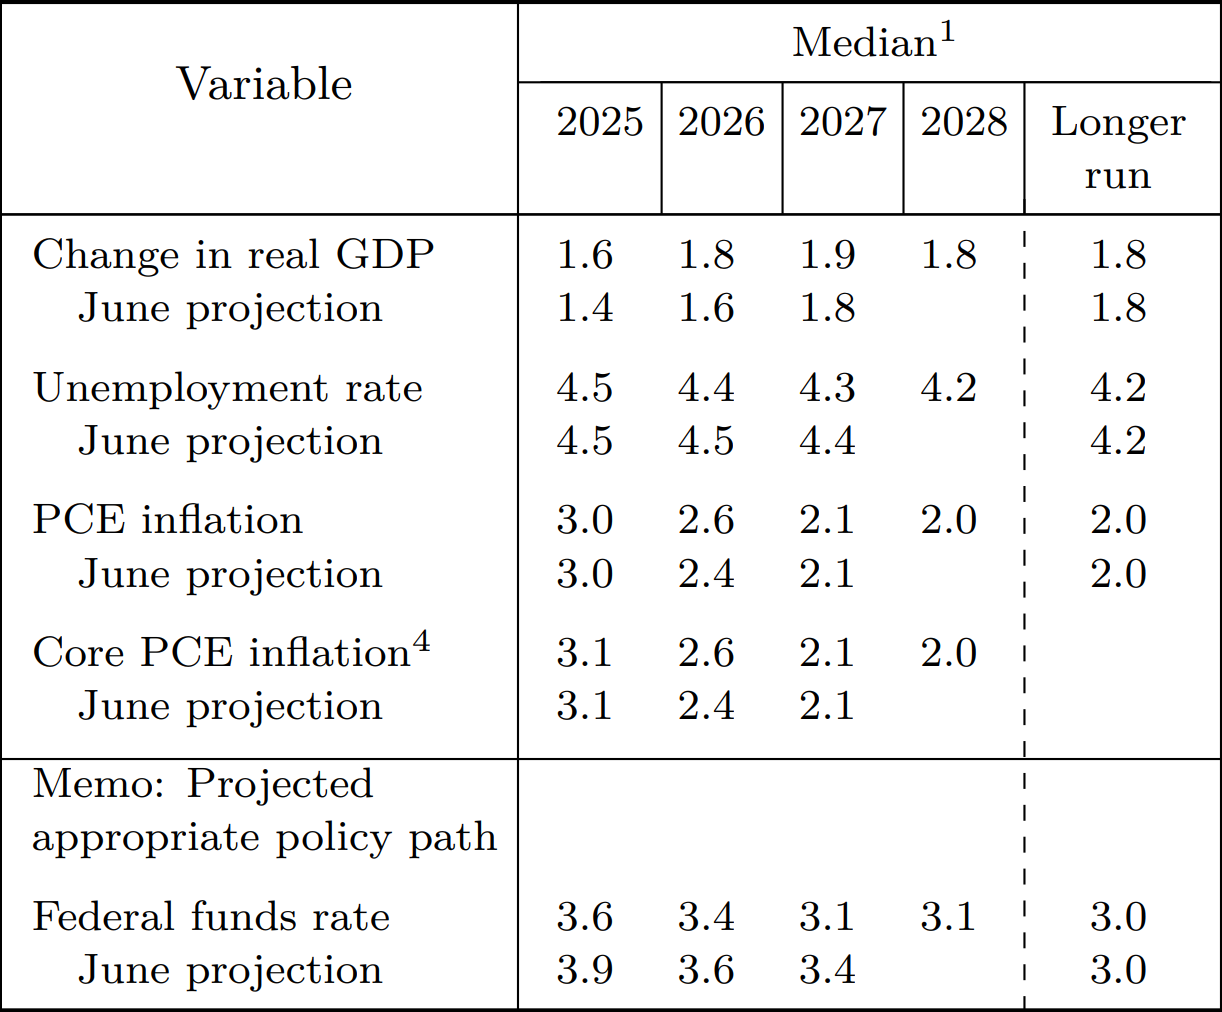
Table from the Federal Reserve’s Summary of Economic Projections (September 17, 2025). The table lists median projections for key economic variables (change in real GDP, unemployment rate, PCE inflation, core PCE inflation, and federal funds rate) for years 2025–2028 and the longer run. Each variable is shown with its June projection for comparison. The table ends with the longer-run projections.
In our view, the risk is the Fed turns more dovish by the December 9-10 FOMC meeting because restrictive monetary policy can worsen the employment backdrop and upside risks to inflation are not materializing.
Three indicators flashing yellow
Three of the six monthly economic indicators used by the National Bureau of Economic Research (NBER) to date on recessions are flashing weakness consistent with a policy stance that is too tight.
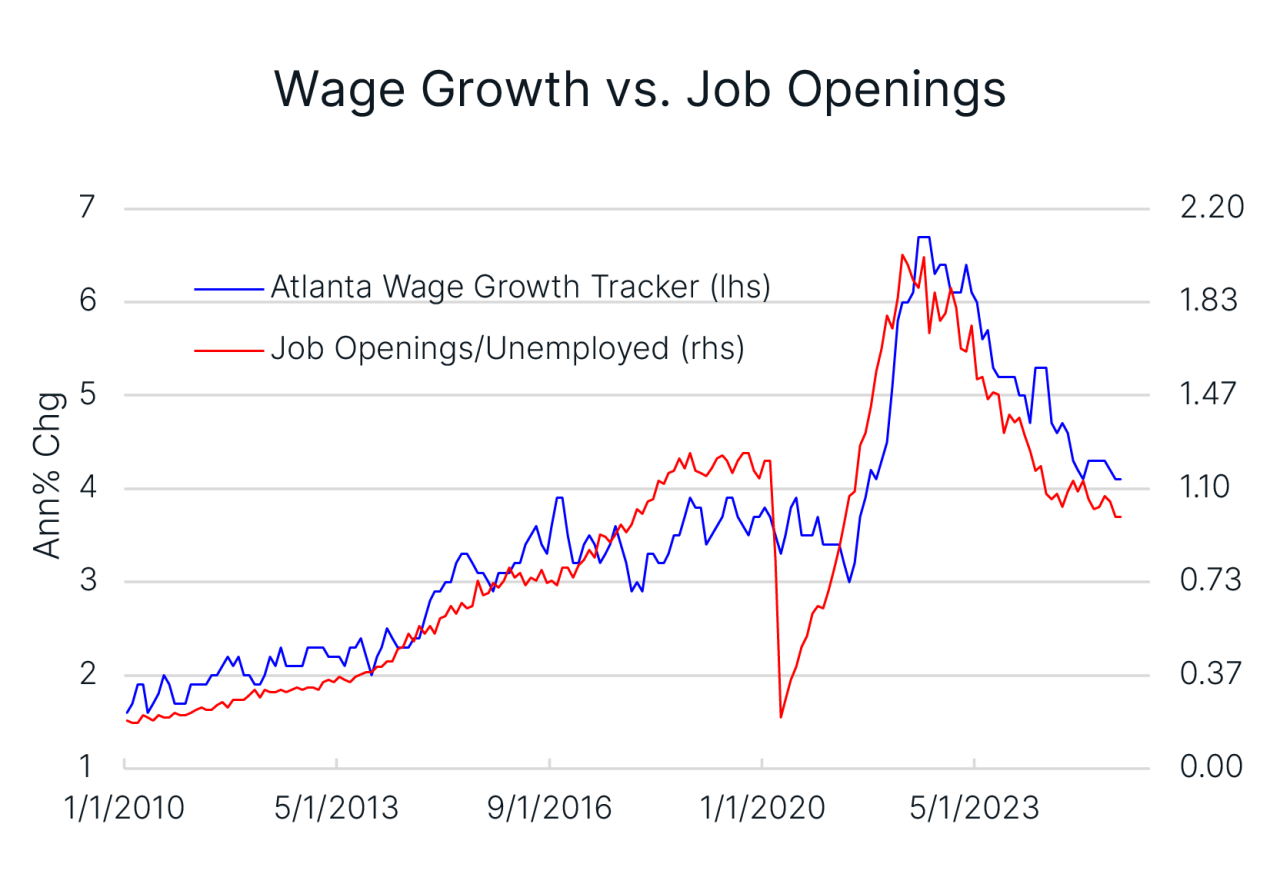
- Real personal income excluding transfers is barely growing (Chart 3). The decline in job openings to unemployed workers points to softer wage growth ahead (Chart 4).
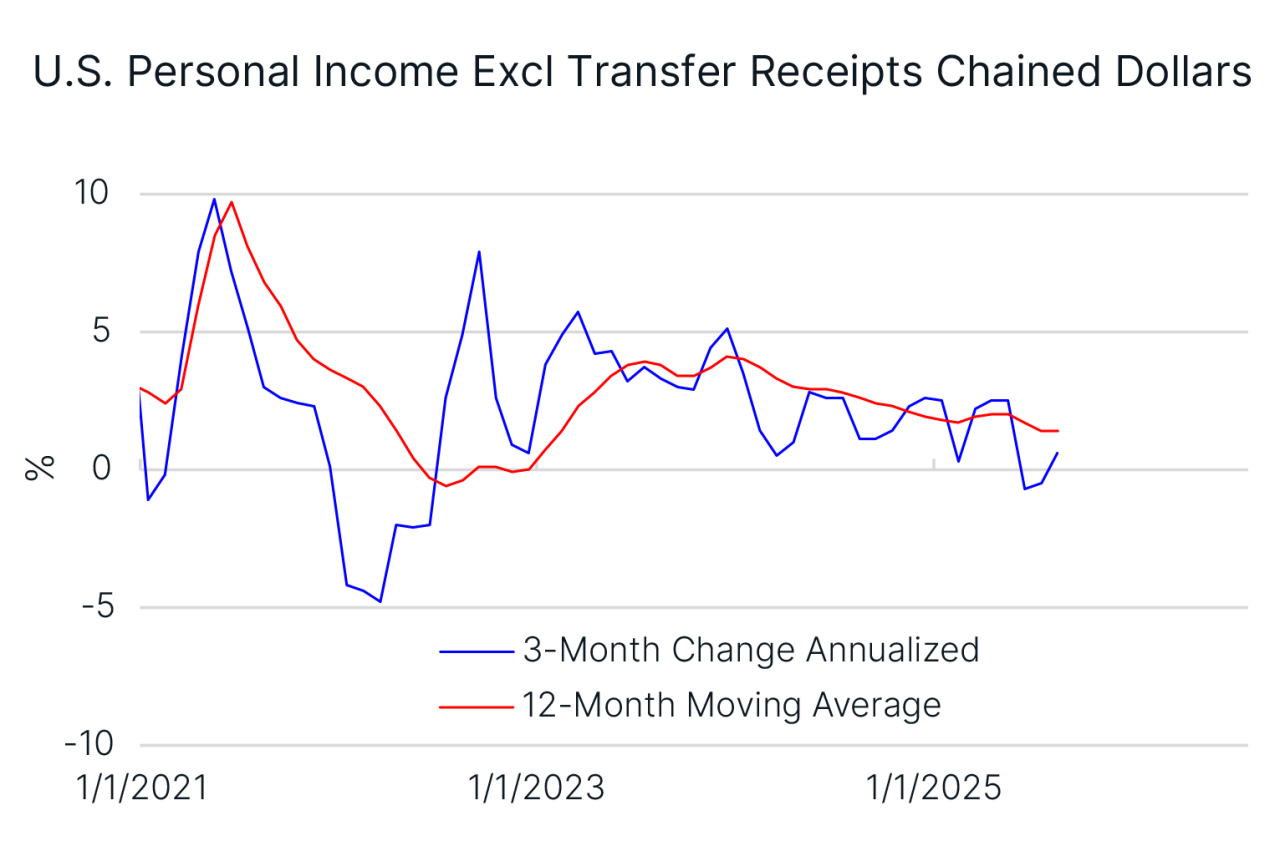
Line chart on the left: A line chart showing the U.S. Personal Income Excl Transfer Receipts Chained Dollars. The blue shows 3-month charge annualized and the red shows 12 month moving average. The time period takes place from 1/1/2021-1/1/2025. Highs took place in 2022.
Line chart on the right: Line chart showing the Atlanta Wage Growth Tracker and Job openings and unemployment from 1/1/2010 through 5/1/2023. The high for wage growth and job openings occurred in 2023.
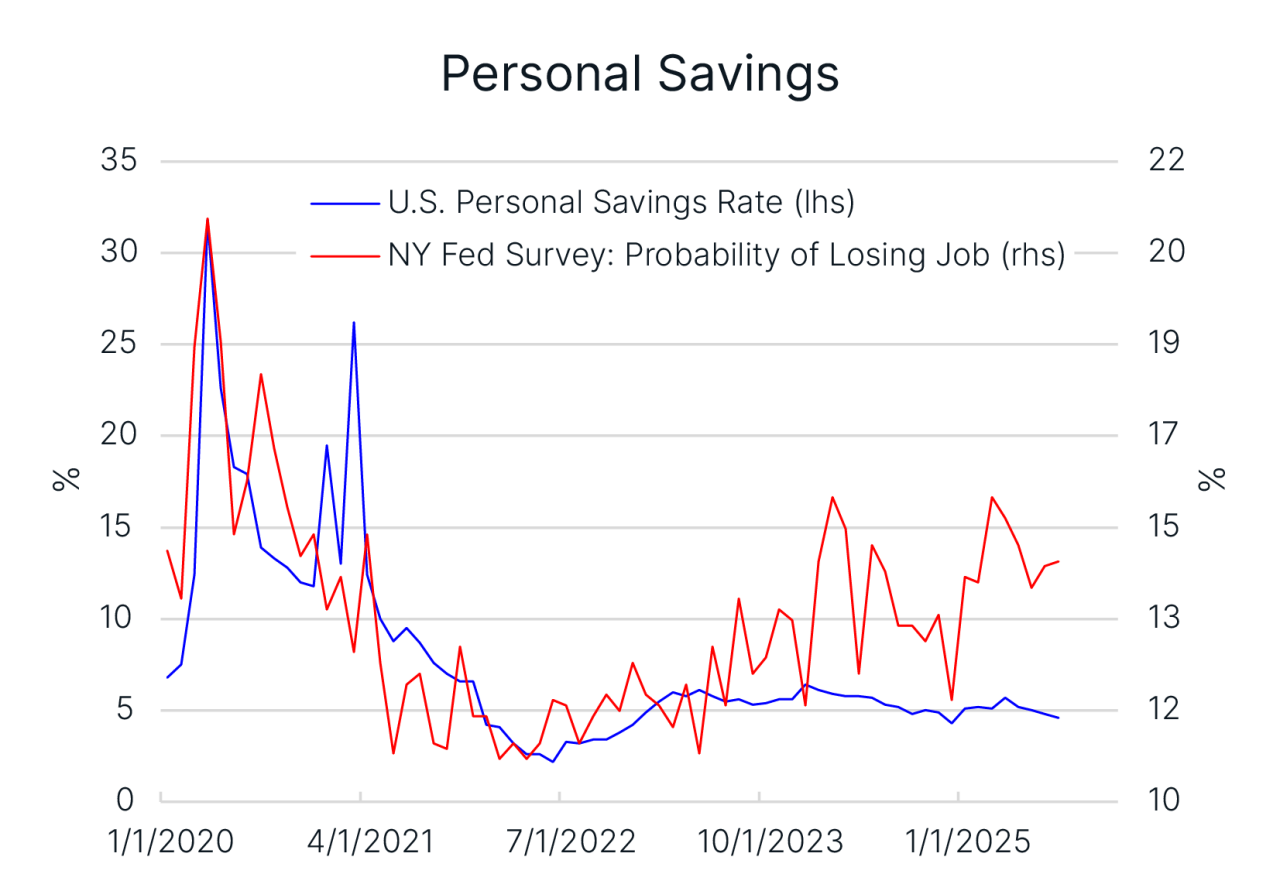
2. Real personal consumption spending is growing above trend (Chart 5). However, the pick-up in consumer spending looks fragile given subdued real wage growth, while rising job insecurity could prompt households to save more, further restraining demand (Chart 6).
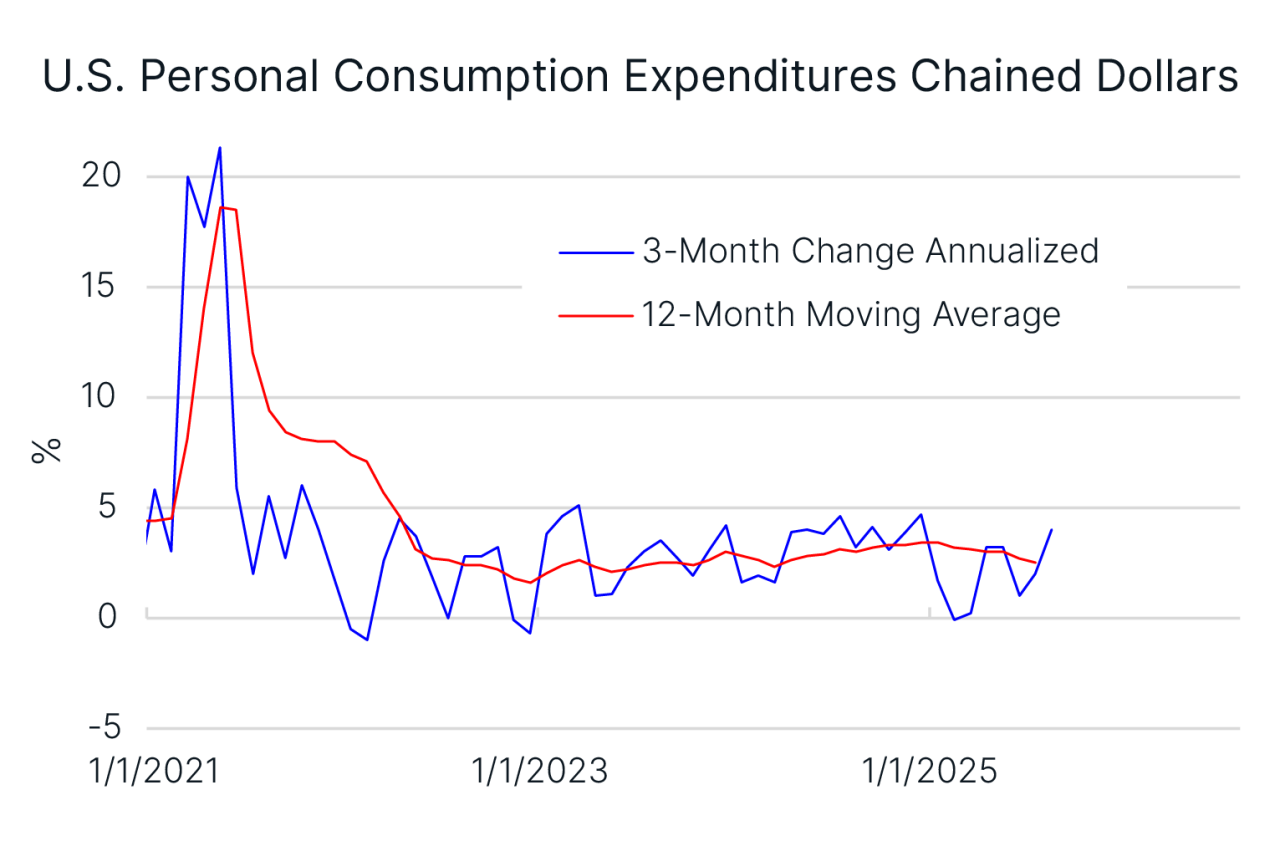
Line chart on left: A line chart showing the U.S. Personal consumption expenditures chained dollars. The blue shows the 3 month change annualized and the red shows the 12-month average. The time frame is between 1/1/2021 and 1/1/2025, with highs in 2021 for both averages.
Line chart on the right: A line chart showing monthly values from January 2010 to August 2025. The chart tracks two series: one ranging from 1.6 to 5.1, and another from 0.18 to 1.09. The x-axis displays dates, and the y-axis shows numeric values. The series are blue as U.S. Personal savings rates and red as NY Fed Survey: probability of losing job.
3. Real manufacturing and trade industries sales recovered towards trend growth (Chart 7). Nonetheless, the ISM manufacturing exports orders index remains below the 50 boom/bust level indicative of renewed weakness in this sector.
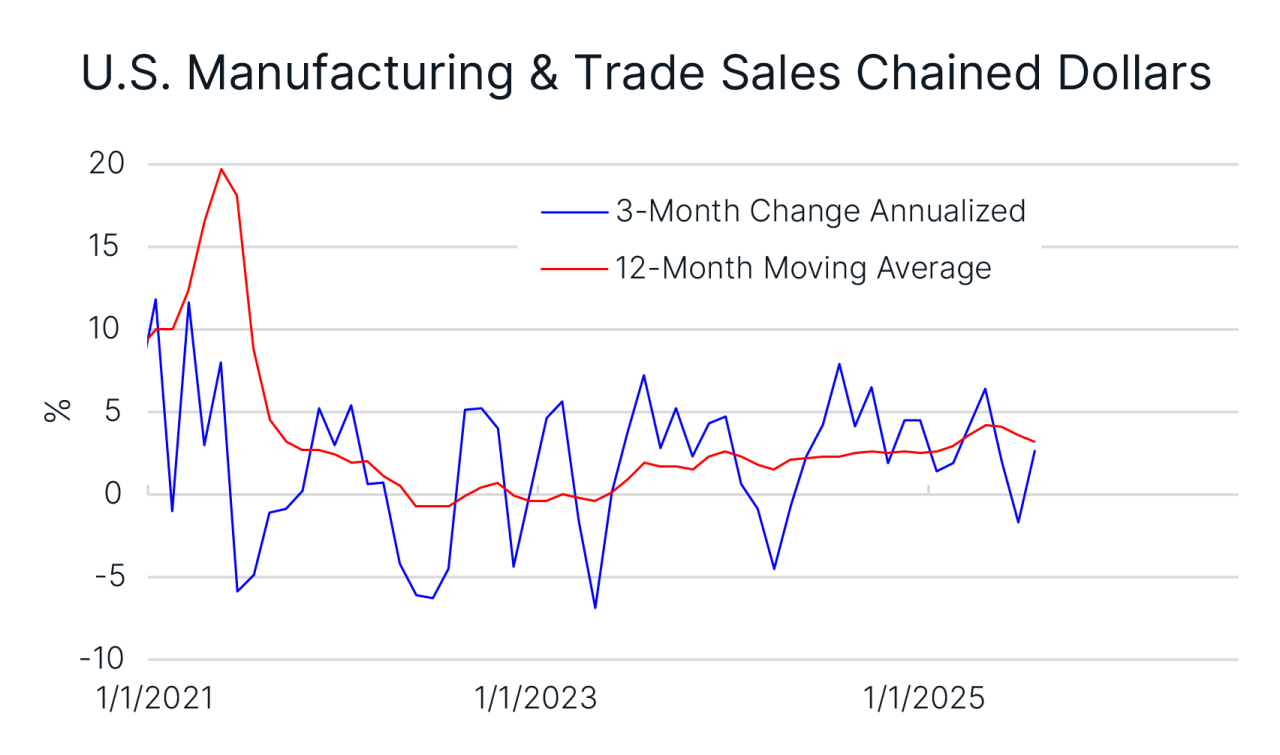
A line chart showing data between 1/1/2021-1/1/2025 of the U.S. manufacturing and trade sales chained dollars. The chart shows the 3 month change annualized in blue and 12 month moving average in red.
4. Industrial production is growing at trend and the outlook is encouraging (Chart 8). The rising ISM manufacturing new orders-to-inventories ratio suggest firms may need to ramp-up production as demand is outpacing supply.
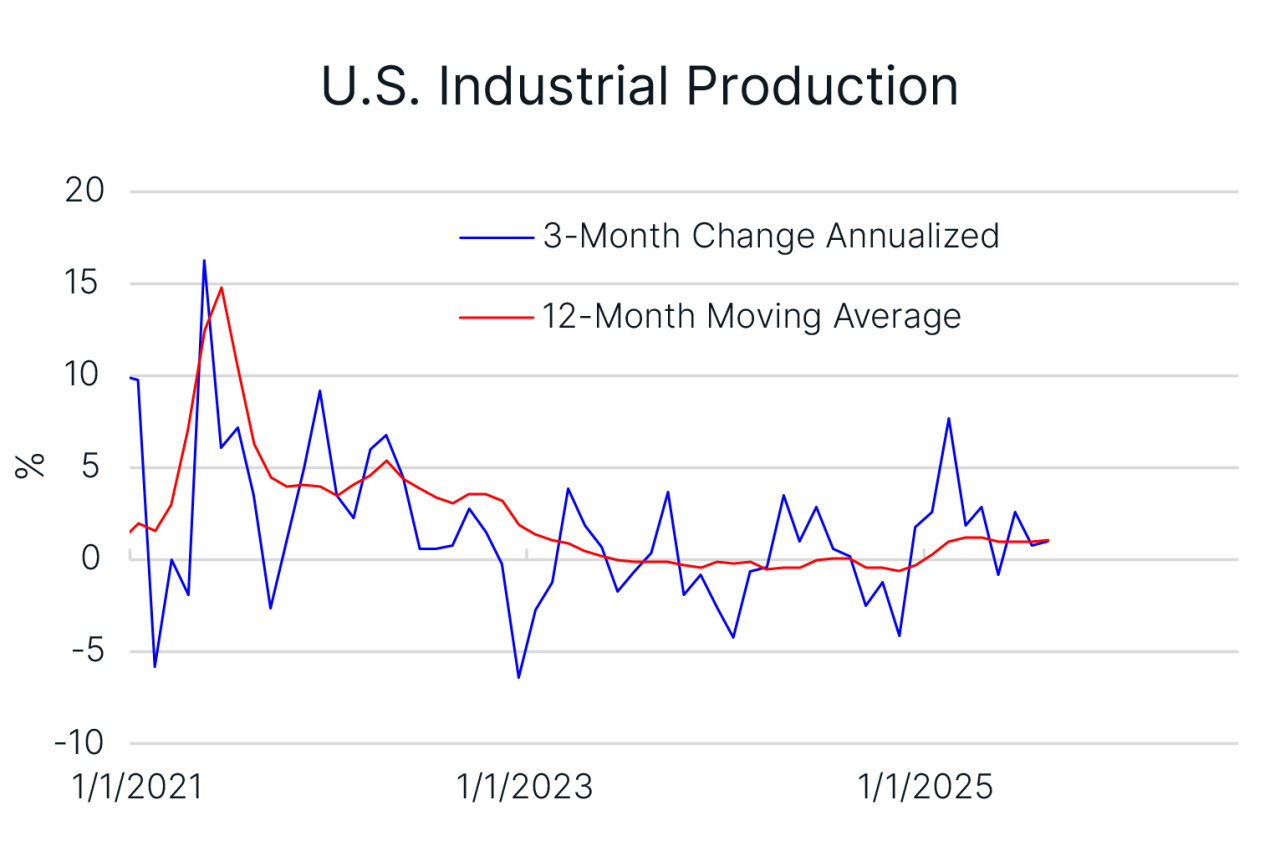
The line graph shows the U.S. industrial production during 1/1/2021 through 1/1/2025. Numbers spiked in 2021, then gradually went down. The lines show the 3 month change annualized in blue, and the 12 month moving average in red.
5. Monthly payroll gains are close to zero growth (Chart 9). In fact, the economy added just 29k jobs on average in June, July, and August, well below the breakeven number for keeping the unemployment rate steady - estimated to be between 80k and 100k.
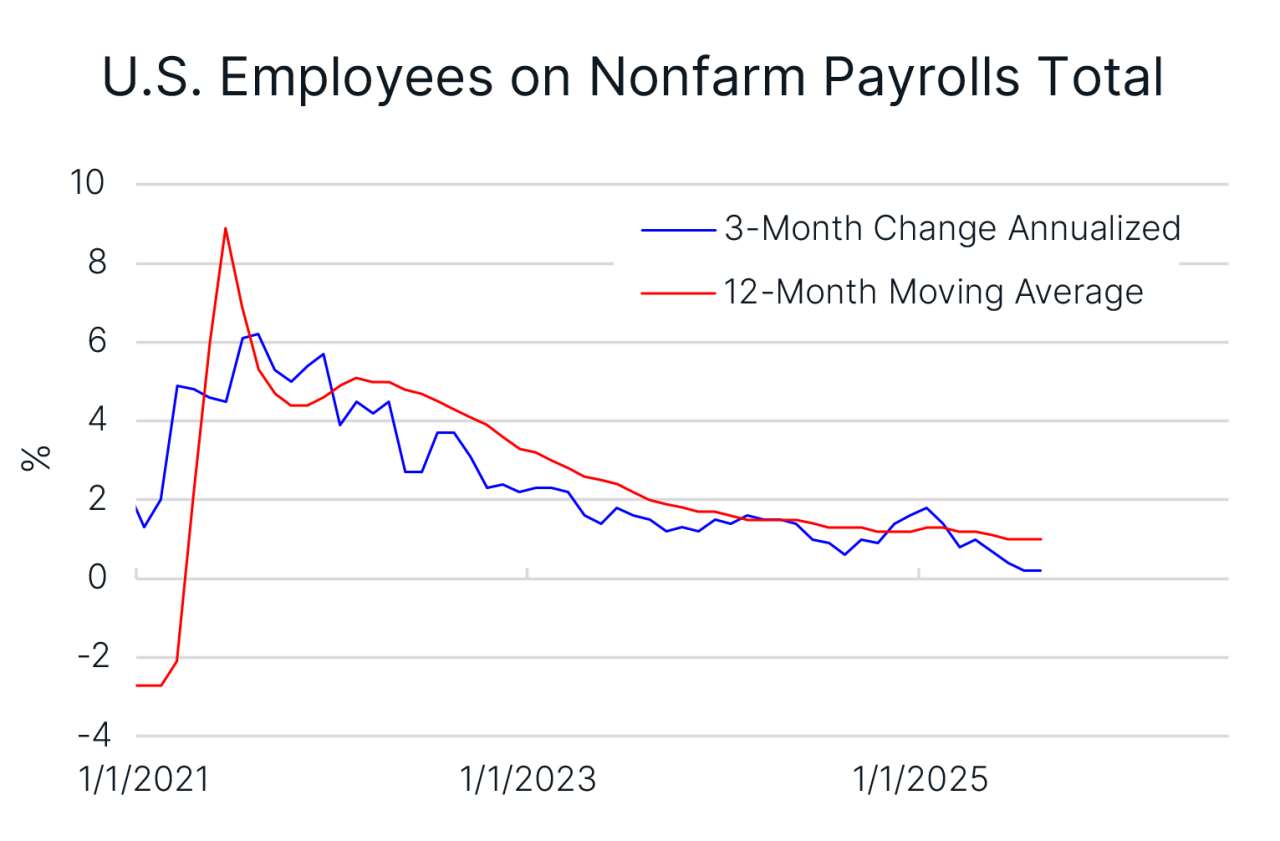
The line chart shows the U.S. employees on nonfarm payrolls total between 1/1/2021 thorugh 1/1/2025. The blue line shows the 3 month change annualized and the red line shows the 12 month moving average. Both results showed a spike in 2021.
6. Labor force growth is virtually flat (Chart 10). Lower immigration and lower labor force participation can further restrict labor supply growth. Fewer workers entering the market reduces potential GDP growth, which in turn dampens demand for goods and services. Firms may respond by curbing hiring, feeding into a self-reinforcing downturn.
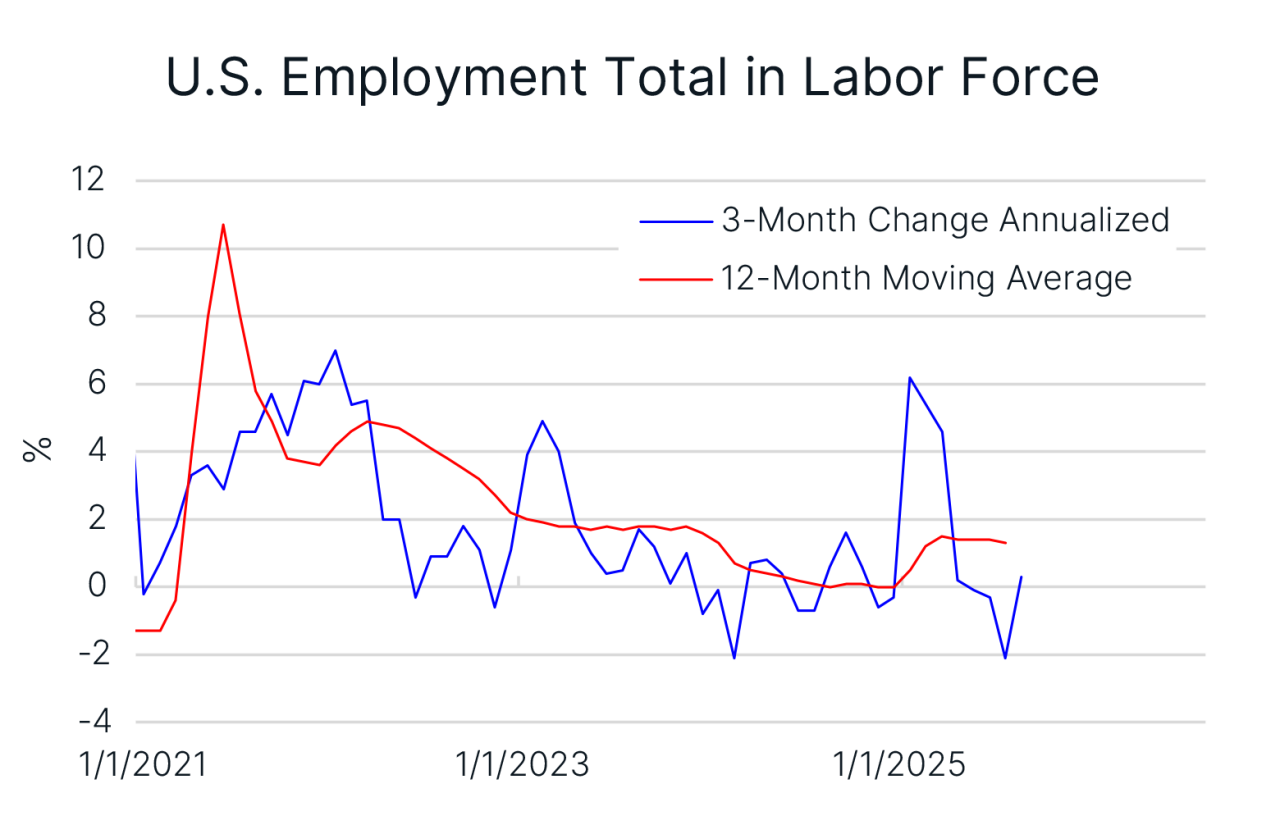
The line graph shows the U.S. employment total in labor force between 1/1/2021 through 1/1/2025. The graph shows a spike in 2021 between both lines. The red line is the 12 month moving average and the blue shows the 3 month change annualized.
The labor market data is the most important driver for the Fed and the most critical data for monitoring downside risks to the economy. As such, the pace of decline in the Fed funds rate will be driven by the three remaining monthly non-farm payrolls reports for the year (due out on October 3, November 7, and December 5).
Inflation contained
Progress towards the Fed’s 2% inflation goal may be stalling, but upside risks to prices are not materializing. The policy-relevant headline PCE deflator has yet to reflect the rise seen in the ISM prices paid indexes, which may now be topping-out (Chart 11). More importantly, wage growth is running around sustainable rates consistent with the Fed’s 2% inflation goal given annual non-farm productivity growth of around 2%.
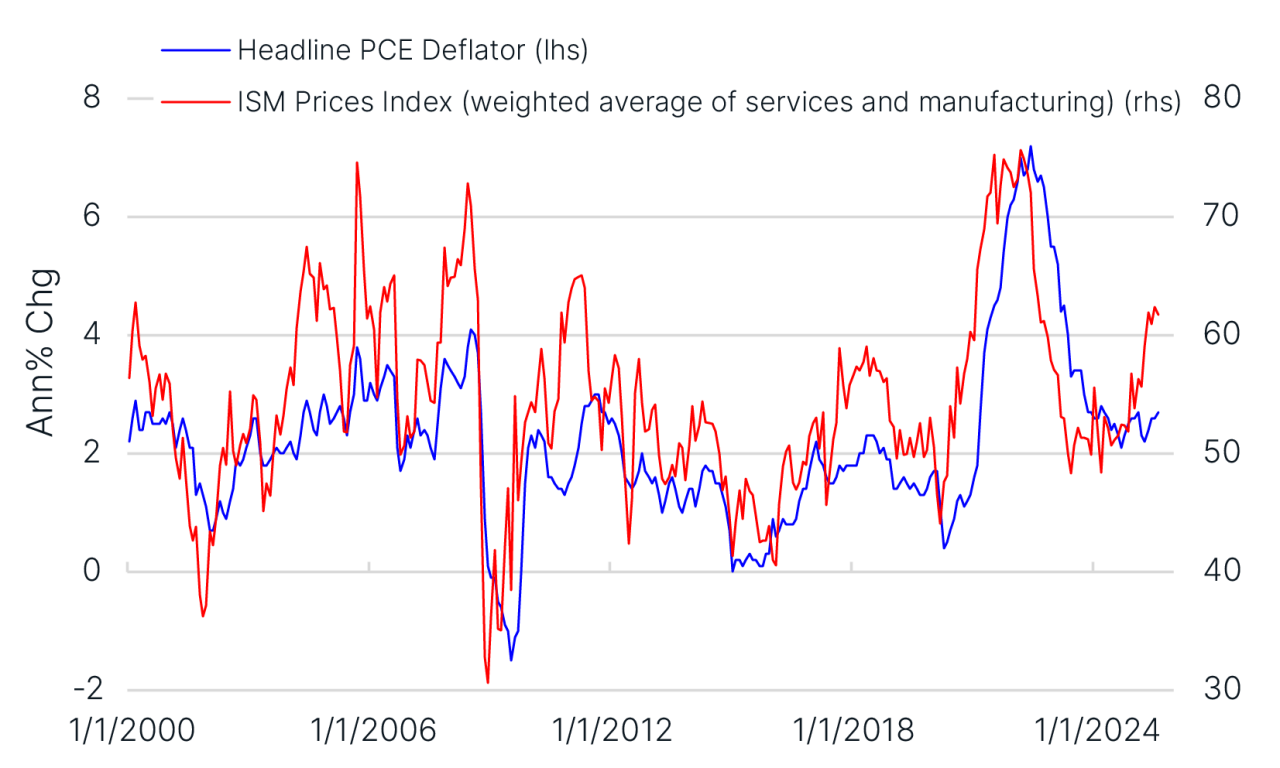
A line chart comparing Headline PCE Deflator (Ihs) and ISM Prices index (weighted average of services and manufacturing) (rhs) showing data between 1/1/2020 AND 1/1/2024, with scattered data between the entire time frame, ranging from -2 to 8, and 30 to 80.
Bottom line
Our base case is for the Fed to pivot to a more dovish position by year-end, which will weigh on the US dollar and further fuel the rally in equity markets.
Two risk scenarios could keep the Fed anchored to its patient easing guidance: US inflation quickens, or the economy enters a Goldilocks1 phase. The first scenario is dollar-negative, implying higher likelihood of stagflation. The second scenario is dollar positive. We see the first risk scenario as more likely.

1 Economist David Shulman coined the phrase to describe an economy that is running neither too hot or too cold and is just right. Source: Investopedia.
Brown Brothers Harriman & Co. (“BBH”) may be used to reference the company as a whole and/or its various subsidiaries generally. This material and any products or services may be issued or provided in multiple jurisdictions by duly authorized and regulated subsidiaries. This material is for general information and reference purposes only and does not constitute legal, tax or investment advice and is not intended as an offer to sell, or a solicitation to buy securities, services or investment products. Any reference to tax matters is not intended to be used, and may not be used, for purposes of avoiding penalties under the US Internal Revenue Code, or other applicable tax regimes, or for promotion, marketing or recommendation to third parties. All information has been obtained from sources believed to be reliable, but accuracy is not guaranteed, and reliance should not be placed on the information presented. This material may not be reproduced, copied or transmitted, or any of the content disclosed to third parties, without the permission of BBH. All trademarks and service marks included are the property of BBH or their respective owners.© Brown Brothers Harriman & Co. 2025. All rights reserved. IS-11019-2025-09-22