Charting the nonbank lending landscape

In a series of whitepapers, we dive into the nonbank lending sector and its opportunities. Here, we examine how the history and dynamics of the nonbank lending landscape contributed to its rise over the past two decades.

Expanding horizons in U.S. nonbank lending


The U.S. has the most dynamic financial system and capital markets in the developed world. Borrowers and lenders can access and extend credit through plentiful bank and capital market channels. The Global Financial Crisis (GFC) and its legislative repercussions curtailed banks’ risk-taking activities. Nonbank lenders (NBL) stepped into the vacuum, growing and evolving to maintain the credit creation vital to consumer and economic health. Yet as its economic importance grows, much of the NBL sector remains poorly understood and sparsely invested, offering investors attractive compensation amidst some unfamiliar risks.


In a series of whitepapers, we dive into the NBL sector and its opportunities. In a previous article, we reviewed the vast landscape of U.S. lending and how the complex sector of NBL fits into it. Now, we look at the history and dynamics behind the NBL landscape in order to explain the rise and evolution of this $17 trillion sector over the past two decades.

Why is the NBL landscape so varied?

The primary catalyst for the varied NBL landscape is the federal government, through legislation and regulation. Implied government support for the government-sponsored enterprises (GSEs) and consequent low financing costs explain the dominance of the agency mortgage-backed securitization trusts (agency mortgage-backed securities [MBS]) in single-family and multifamily residential mortgages. Real estate investment trusts (REIT) and business development companies (BDC) legislation also encouraged the growth of tax-efficient public vehicles for mortgage and commercial loans, respectively – you now find the bulk of nonagency multifamily mortgages in levered REIT vehicles and more than half of direct loans in BDCs.


A graphic titled “U.S. private lending by holder ($ billion) – total $7 trillion” depicting the breakdown of U.S. loans across lenders. This emphasizes the vastly varied NBL landscape.

Dodd-Frank legislation, interagency guidance on leveraged lending, required capital boosts, and liquidity requirements have all shifted banks away from lending to leveraged and smaller companies and below-super-prime borrowers. Hence the prominence and growth of independent finance companies, and their related BDC, collateralized loan obligations (CLO), and asset-backed securities (ABS) financing sources, over the last 15 years.

Another change agent is the dynamism and vast capital of the private equity (PE) and private credit ecosystem, which finances not just the borrowers marginalized by the banks but also competes directly for the larger loans and prime borrowers that banks target. The pace of business and structural development in privates is far more rapid than at the utility-like banks, suggesting privates’ outsized growth and competitive pressure may continue, particularly as investors discover value in direct private opportunities.

A final force is the continued evolution of securitization as both financing source and investment, along with its supporting legal framework. Like any technology, the structural safeguards and flexibility afforded by securitizations have evolved and improved through successive market tests like the GFC and the COVID-19 pandemic. The bankruptcy-remoteness of securitization trusts continues to be definitively affirmed by U.S. courts. Application of ABS, commercial mortgage-backed securities (CMBS), CLOs, and other securitizations should continue to outpace broader lending market growth.


The evolution of the nonbank ecosystem

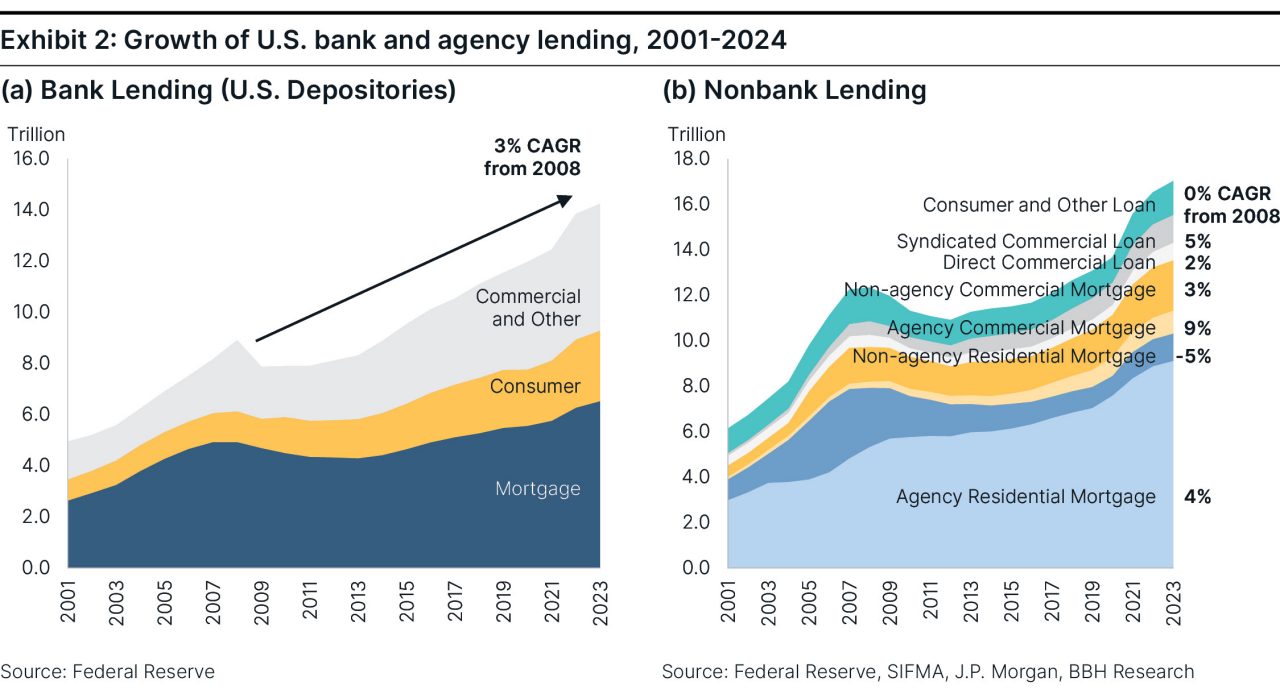
It’s useful to chart not just the current landscape of NBL but also its evolution over the last 20 years. Oddly, annual growth in the “dynamic” nonbank sector (2% annual) has trailed bank lending (3%) since the GFC. Hence, each sector is about the same size as it was at the end of 2008, adjusting for inflation.

The stall in bank lending growth is understandable. Since the early 1990s, consolidation has magnified average bank size. A greater share of a typical bank’s business is focused today on large commercial customers and higher quality consumer borrowers than in the past. Post-GFC regulation forced banks to de-lever, exit their higher leverage loans, and hold more liquid securities at the expense of loans. Large systemically important banks are capped in size, while the deposit stability advantage of regional and smaller banks has recently come into question.

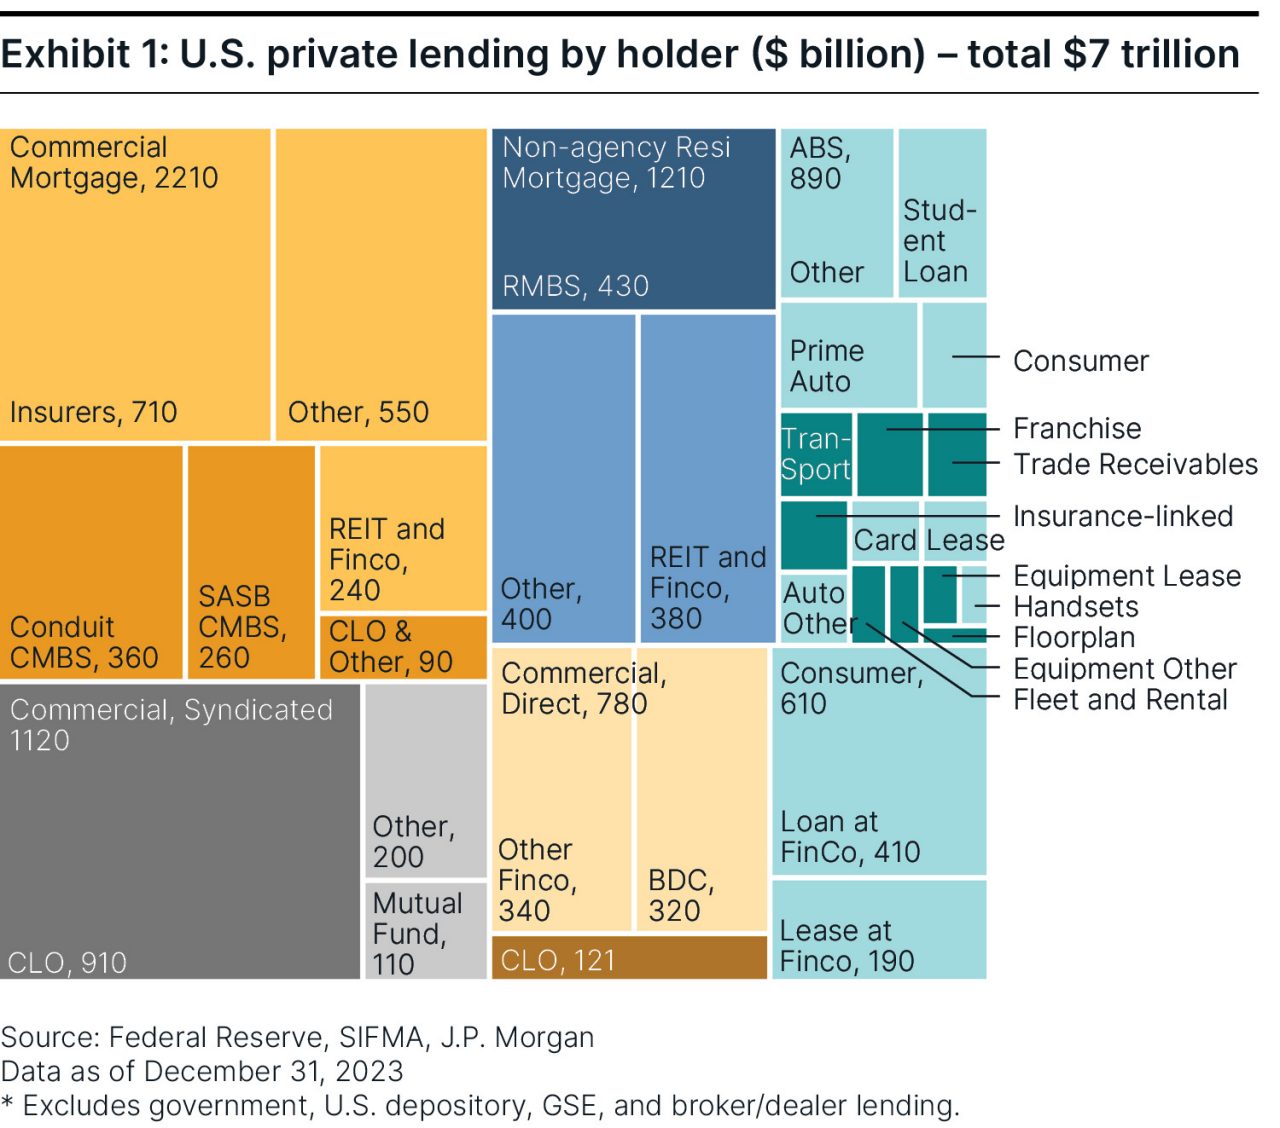
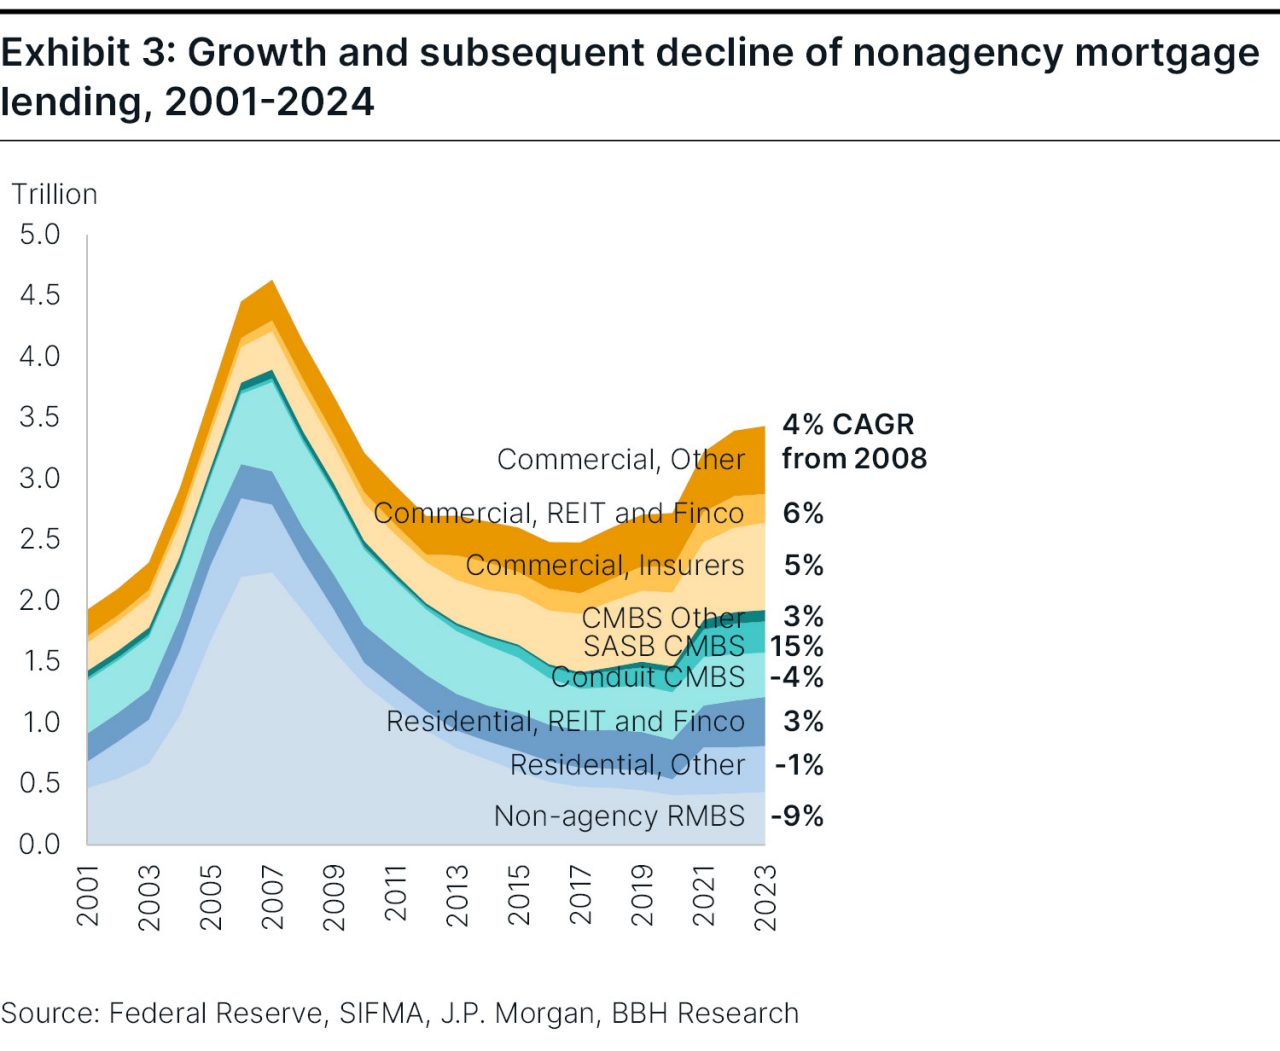
The slower growth of NBL since the GFC is more surprising. It’s a compositional effect from the burst of the early 2000s bubble in nonagency mortgage lending, which had reached $3 trillion in size by 2008. As housing prices declined, mortgage performance deteriorated, new origination shut down, and the sector cratered to its $1 trillion size today.

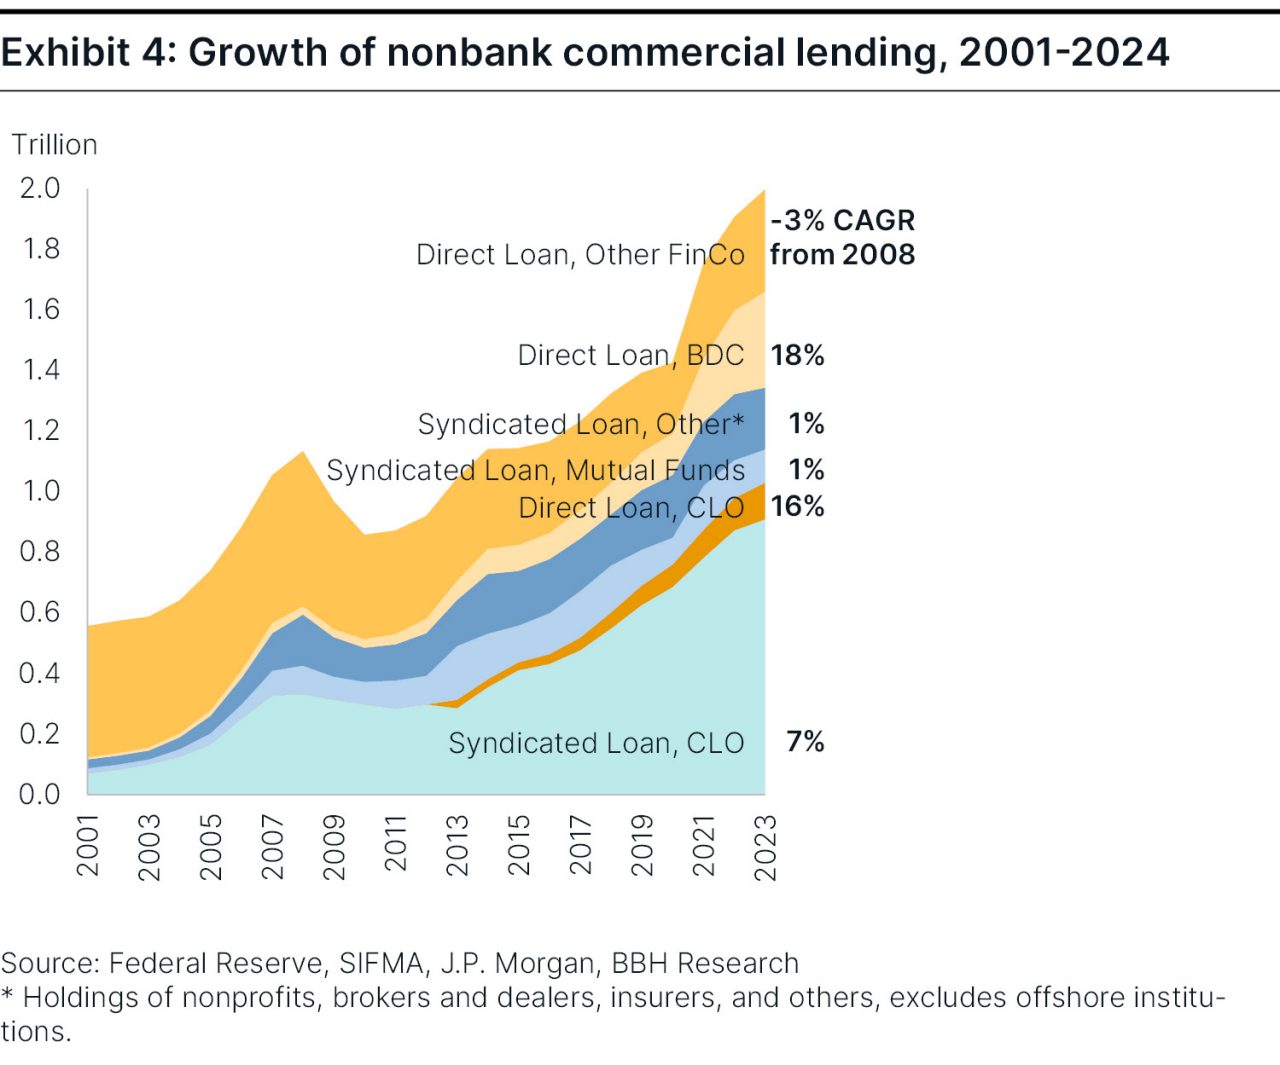
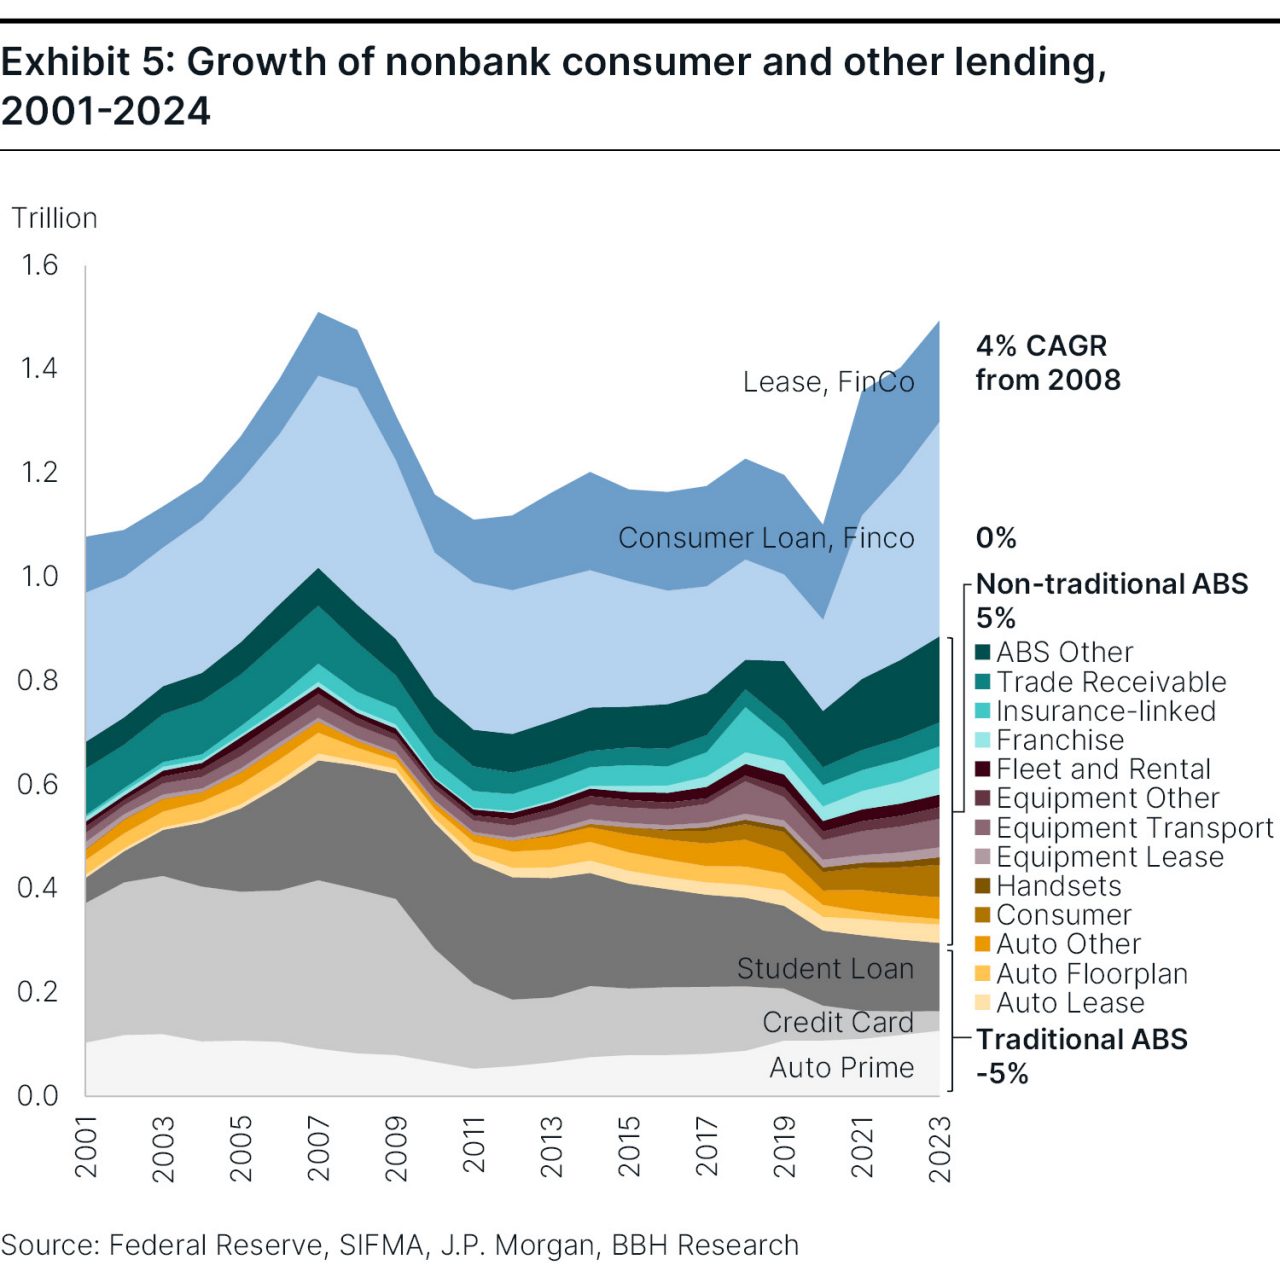
Remove residential mortgages and one finds that the other segments of NBL have grown like or faster than bank loans. NBL growth has hastened particularly in the last five years: agency pools by 6% annually, nonagency commercial mortgages by 6%, syndicated commercial lending by 7%, direct commercial lending by 11%, and by 10% or more in many specialized lending segments commonly financed with ABS (e.g., consumer installment, auto and equipment lease, franchise, data centers and fiber, venture and recurring revenue debt, rental and fleet, and other specialized segments).

NBLs have stepped in where banks have retreated, particularly in middle-market commercial lending, personal lending to below-super-prime borrowers, and specialized lending. New required disclosures have shrunk the number of U.S. exchange-listed companies. In reaction, new lending models are being pioneered by private lenders to be more flexible in underwriting. PE and credit providers are filling the gap left by the banks and exchanges.


A chart depicting the growth of U.S. bank lending from 2001 through 2024. It underscores the relatively flat growth of bank lending, with a nominal CAGR of 3% since 2008.

Charting the evolution of NBL over the last two decades offers additional insight. Exhibit 2(a) underscores the flat growth of bank lending, with a meagre nominal CAGR of just 3% since the GFC. In contrast, as seen in Exhibit 2(b), much of the NBL sector has grown at swifter annualized rates. These very broad NBL categories conceal even more dynamic growth in certain segments of the NBL market, which we explore below.

Nonagency residential mortgage lending is a shadow of its former size (see blue in Exhibit 3), but some new supply has been available in less-traditional investments, such as agency risk transfer, single family rental debt, and nonqualifying mortgages. Swifter growth is evident in nontraditional commercial mortgage investments, such as single-asset, single-borrower (SASB) CMBS and commercial mortgage REITs issuing commercial real estate (CRE) CLOs.


A chart titled “Growth and subsequent decline of nonagency mortgage lending, 2001-2024” showing the change in size across nonagency residential; residential; residential, REIT, and Finco; Conduit CMBS; SASB CMBS; CMBS Other; Commercial, insurers; commercial, REIT, and Finco; and commercial, other mortgages. Nonagency residential mortgage lending declined post-GFC, but swifter growth is evident in nontraditional commercial mortgage investments.

In commercial lending (see Exhibit 4), the swift 11% growth of direct commercial lending over the last five years has been financed primarily through BDCs – which have grown at a remarkable 25% rate – as well as through middle-market CLOs (MM CLOs), with 18% growth. Funds and finance companies have basically been static over that period. Syndicated loan market growth has also been swift and absorbed almost entirely in CLOs, as mutual fund holdings have declined.


A chart depicting the growth of nonbank commercial lending, 2001-2024. Direct commercial lending has experienced swift 11% growth over the last five years, financed by BDS (grew at 25% rate) and middle-market CLOs (grew at 18% rate).

Moderate overall growth in U.S. consumer and other lending (see Exhibit 5) masks the rapid rise of more specialized lending segments against the decline of traditional lending channels. Bank accounting rule changes have effectively eliminated the large credit card ABS market. Direct federal lending to students has similarly diminished student loan ABS. Growth has been dynamic in the rest: ABS segments catering to nontraditional asset types including triple net lease, transportation, data centers and fiber, auto and equipment lease, smartphone handset financing, venture and recurring revenue debt, fund financing, and many others.


A chart depicting the growth of nonbank consumer and other lending, 2001-2024. Moderate overall growth in U.S. consumer and other lending masks the rapid rise of more specialized lending segments against the decline of traditional lending channels.

The balance sheet growth of these same specialized lenders outpaced this moderate growth and foreshadowed further ABS financings.

Charting the nonbank lending landscape

Conclusion

Over the past two decades, NBLs have rapidly expanded to fill gaps left by traditional banks, especially in specialized and middle-market lending. Driven by regulatory shifts, private capital, and evolving securitization structures, NBLs now play a vital role in credit creation across diverse sectors. Their continued growth underscores both the resilience and complexity of the U.S. financial ecosystem.

The author would like to thank Thomas Brennan, John Ackler, Tim Rourke, Chris Ling, Vaidas Nutautas, and Anthony Sylvester for their contributions to this piece.

Contact Us

 Investment graph and rows growth of coins on display of market quotes
Up Next
Up Next

A prudent approach to loan-based investment

In a series of whitepapers, we dive into the nonbank lending sector and its opportunities. Here, we discuss a prudent time-tested approach to applying the BBH investment principles across this vast landscape.

Brown Brothers Harriman & Co. (“BBH”) may be used to reference the company as a whole and/or its various subsidiaries generally. This material and any products or services may be issued or provided in multiple jurisdictions by duly authorized and regulated subsidiaries. This material is for general information and reference purposes only and does not constitute legal, tax or investment advice and is not intended as an offer to sell, or a solicitation to buy securities, services or investment products. Any reference to tax matters is not intended to be used, and may not be used, for purposes of avoiding penalties under the U.S. Internal Revenue Code, or other applicable tax regimes, or for promotion, marketing or recommendation to third parties. All information has been obtained from sources believed to be reliable, but accuracy is not guaranteed, and reliance should not be placed on the information presented. This material may not be reproduced, copied or transmitted, or any of the content disclosed to third parties, without the permission of BBH. All trademarks and service marks included are the property of BBH or their respective owners. © Brown Brothers Harriman & Co. 2025. All rights reserved. PB-08872-2025-08-28

As of June 15, 2022 Internet Explorer 11 is not supported by BBH.com.