


A graphic depicting direct investment opportunities in NBL across residential and commercial mortgages, commercial lending, and consumer and other lending. Each loan type is broken down into different segments and common financing vehicles.
Expanding horizons in U.S. nonbank lending
The U.S. has the most dynamic financial system and capital markets in the developed world. Borrowers and lenders can access and extend credit through plentiful bank and capital market channels. The Global Financial Crisis (GFC) and its legislative repercussions curtailed banks’ risk-taking activities. Nonbank lenders (NBL) stepped into the vacuum, growing and evolving to maintain the credit creation vital to consumer and economic health. Yet as its economic importance grows, much of the NBL sector remains poorly understood and sparsely invested, offering investors attractive compensation amidst some unfamiliar risks.
In a series of whitepapers, we dive into the NBL sector and its opportunities. In a previous article, we discussed using prudent, time-tested investment principles focused on capital preservation, thorough research, strong lender relationships, rigorous valuation frameworks, and abundant sourcing to navigate risks and seize opportunities across the NBL sector. Now, we take a closer look at these opportunities.
The NBL landscape is vast and varied. Exhibit 1 represents a tapestry of the richness and complexity of investment opportunities in the $17 trillion NBL market. As we describe the opportunity set in this article it may be helpful to refer back to this landscape.
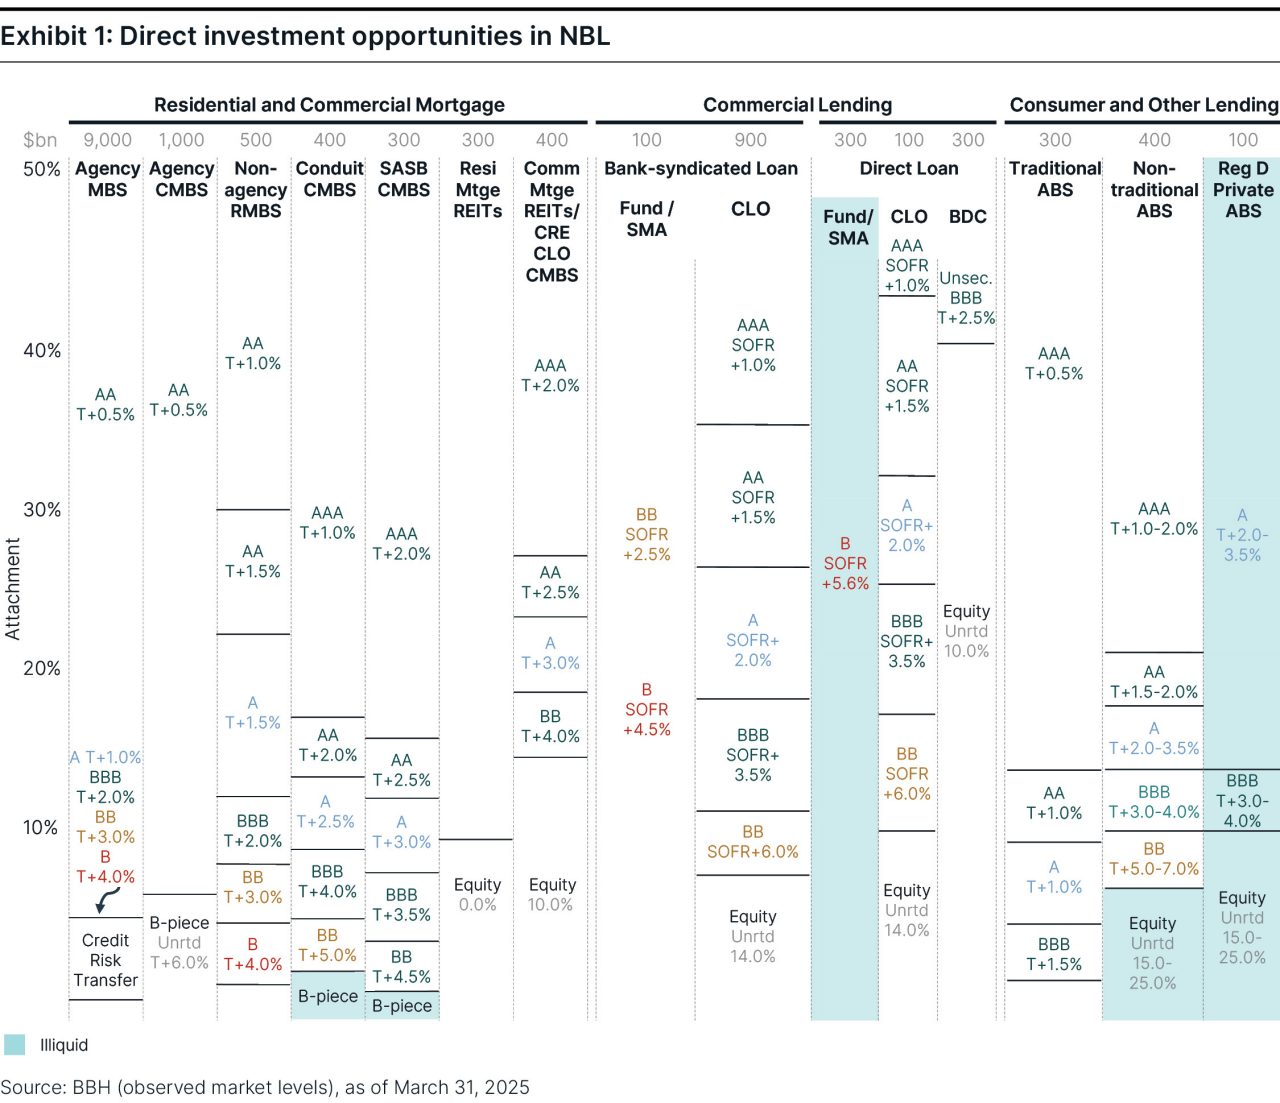
First, at the top, loan types are divided into three sections: residential and commercial mortgage, commercial lending, and consumer and other lending. Within each loan type, we further divide the pool into different segments and more common financing vehicles labeled in black text. For instance, in commercial lending, we have unlevered bank-syndicated loan (BSL) funds/separately managed accounts (SMAs), BSL collateralized loan obligations (CLOs), unlevered direct loan fund/SMAs, direct loan (middle-market) CLOs, and business development company (BDC) direct loans. The size of each segment is given in blue text – it’s not to scale, but provides a reminder of relative outstanding size.
The vertical axis is to scale and represents where each investment type “attaches” in seniority within a pool of loans of that type – for instance, BSL CLO equity typically represents the most junior 14% of a BSL loan pool, while the senior AAA-rated represents the 65% senior piece of the pool and benefits from credit support of the roughly 35% of pool investments that are junior to it.
Ratings for each investment type are indicated in colors common to that rating across loan segments. In the same color, a typical approximate average compensation level in normal markets is given for each investment type, either as total return, like 14%, or as a spread to a benchmark rate, like T+3% (i.e., Treasuries + 300 basis points [bps]).1 Note that expected investor compensation here is provided net of expected credit, option, and management fee costs.
Finally, generally illiquid investment types are indicated by a light blue dotting. Next, we review the features and compensation of the plethora of investment types.
Residential mortgages
Residential mortgages (loans secured by single-family houses or multifamily homes) are the largest type of lending in the U.S., representing more than $4 trillion of bank lending and the majority ($11 trillion) of NBL. Nonbank residential mortgages fall into two segments: agency and nonagency. The issuance of agency mortgage-backed securities (MBS), guaranteed by one of three government entities (Ginnie Mae, Freddie Mac, and Fannie Mae), dates back to the 1970s and dominates the residential lending landscape.
Agency mortgages: Securitized loan “pools” carry minimal credit risk due to backing of the U.S. government. Investors in these high-investment grade bonds earn option-adjusted yields that are typically 0.5% or less over Treasury yields for bearing interest rate and prepayment risk.
Freddie B-Pieces: Over the past 15 years, the agencies have encouraged private investors to take nonguaranteed junior risk participations in the performance of agency multifamily mortgage pools. For example, since 2009 expert investors have taken the unrated junior first-loss “B-piece” of Freddie multifamily loan securitizations, a high-quality loan type, at spreads typically 5% or more over Treasuries, in exchange for bearing historically ultra-low principal impairment risk in these pools.
Agency credit risk transfer (CRT): More recently, Fannie and Freddie have offered private investors “credit risk transfer” participations at low attachment points (1% to 3%) within agency MBS pools. Credit ratings can range between B and A. Notes offer investors spreads of 1% to 4% over Treasuries for assuming credit, prepayment, and considerable price volatility risk in these thin junior tranches.
Nonagency mortgage loans typically do not conform with underwriting standards of the three government agencies due to higher loan size, limited income documentation, unique loan structures, or nonperforming status. Nonagency mortgages are held by three roughly similar-sized groups: nonagency residential mortgage-backed security (RMBS) pools, real estate investment trusts (REITs) and finance companies, and other holders (primarily governments).
Nonagency RMBS: Like agency MBS, RMBS also carry prepayment and interest rate risk, but further expose investors to credit risk in the absence of the agency guarantee. Transactions are structured into tranches, with ratings ranging from AAA to as low as B. Given severe performance through the GFC, the once-massive $2.5 trillion nonagency market has shrunk to just half a trillion dollars, consisting primarily of nonqualifying and reperforming loan pools.
The lower-rated tranches of these capital structures are typically highly leveraged, with credit enhancement levels as low as 0.5%. Spreads to investors for investment grade tranches range from 1% to 2% over Treasuries in this relatively crowded, contracting segment of the nonbank loan market.
REITs and finance companies: Agency mortgage REITs are highly levered, volatile investment vehicles with poor historical returns for equity investors over the last decade and a half. Nonagency mortgage REITs focused on multifamily lending have exhibited more stable performance. These REITs are typically financed via investment grade-rated commercial mortgage-backed securities (CMBS) (or commercial real estate [CRE] CLO) structures with spreads ranging between 2% and 4% over Treasuries. Equity for these REITs can be available in private or public form with expected returns between 8% to 10%, albeit with elevated levels of volatility.
Commercial mortgages
Investment opportunities within commercial mortgages can be split into CMBS (securitizations of commercial loans), whole mortgages, mortgage REITs, and other debt fund vehicles.
Nonagency CMBS: Private-label CMBS are rated securitization notes backed by pools of 30 to 100 mortgage loans (more traditional “conduit” CMBS) or backed by a single mortgage loan on one high-quality property or portfolio of properties (less-traditional single-asset, single-borrower [SASB] CMBS). The CMBS investor base is more limited, and given persisting concerns and stigma associated with CRE, the compensation available for rated notes can be highly attractive to investment grade investors, with senior AAA-rated conduit spreads ranging over 1% and senior AAA SASB from 1.5% to 2.5%. A-rated and BBB-rated tranches typically carry compelling spreads of between 2.5% to 5.5%, offering a substantial lift over similarly rated credit. Callability and extension risk is limited, but downgrade and write-down risk can be meaningful, particularly in conduit CMBS rated BBB and below.
SASB CMBS credit impairment risk is more idiosyncratic given the single-borrower profile. Weaker secondary market or concentrated industry exposure; an occasionally stressed property type, such as the current office environment; or deterioration in sponsor quality and commitment may present credit challenges to SASB trusts. In our experience, exploiting the value in investment grade CMBS, particularly in more junior tranches, requires deep CRE sector knowledge and a conservative approach.
The junior-most residual tranche beneath conduit CMBS transaction, called a B-piece, is unrated and bears first-loss risk from every loan in the pool. Expected unlevered returns of 12% to 15% in B-pieces are subject to considerable volatility based on the performance of the poorest loans in a conduit pool and are typically purchased only by investors performing the deepest loan-level due diligence.
Whole mortgage loans: Given high commercial mortgage exposures, COVID-19-related property stresses, and a rapid rise in interest rates, regional banks have been forced to curb lending and shed some portfolio holdings at fire-sale prices. Insurance companies, on the other hand, have taken advantage to ramp up their presence in the commercial ($700 billion) and residential ($100 billion) whole loan mortgage, driven by both a doubling in annuity-linked products over the past five years and weakness at the regional banks. These mortgages tend to have long 10-year-plus tenors, are conservatively underwritten at 60% to 65% loan-to-value ratio (LTV), and offer compensation about 2% above Treasuries.
Commercial lending
Nonbank loans to corporations are a sizable $2 trillion, a smaller size relative to the $11 trillion corporate bond and $5 trillion commercial and industrial (C&I) bank loan markets, but distinguished by below-investment grade ratings and elevated compensation vs. corporate bonds and bank loans. Nonbank corporate loans split naturally into public BSL to larger firms ($1.2 trillion) and private direct loans ($800 billion).
BSL: Below-investment grade floating-rate loans compose the corporate broadly syndicated loan market. These loans are liquid and typically have BB and B ratings that carry spreads averaging between 2.5% and 4.5% over the Secured Overnight Financing Rate (SOFR), respectively. Investors should decrement these spread levels for historical annual credit losses and option costs associated with the ready callability of loans. Loan indices also exhibit price and return volatility that are similar to high-yield bonds, particularly during risk market selloffs.
CLO: BSL are held directly at public mutual funds, private funds, banks, and insurers, but most are financed through and held in the collateral pools of CLOs. CLOs come in two flavors: the predominant BSL CLOs and the emerging middle-market (MM) CLOs. BSL CLO managers dynamically manage liquid BSL portfolios through primary and secondary market activity. The leading CLO managers have long histories of successful underwriting through market cycles and tend to retain their CLOs’ equity. Spreads available in AAA to A tranches can range from 1% to 2%, while mezzanine BBB to BB tranches can return 4% to 6% over SOFR.
Like BSL, though, CLO debt investors should haircut return expectations given the high callability and price volatility of CLOs. CLO equity investors, on the other hand, gain the option value and collect reasonably stable cash flows, with typical internal rates of return (IRRs) of 14% to 20% through market cycles. Investors should be mindful, however, of the high leverage and extreme price swings in equity positions.
Private direct loans
Private corporate lending has witnessed rapid growth in the past 10 years and enormous attention as a less liquid, lower volatility, and potentially higher return credit alternative to traditional high-yield investments. “Direct lending” and “private credit” are commonly used descriptors. Direct lending typically describes senior secured loans to middle-market companies with EBITDA of less than $200 million. Private credit is more expansive, typically capturing private corporate lending more broadly (direct lending, second lien and mezzanine, distressed debt, and special situations) and sometimes nonrecourse asset-based lending.
There’s a wide range of borrower types, structures, and situations across these loans, but the most common middle-market senior-secured direct loan is from a single lender to a private equity sponsor, covenanted, at 5% to 6% over SOFR. Investors in unlevered funds should expect to decrement expected return by approximately 1% for annual loan loss and another 1%-plus for management fees, as well as expect no liquidity – though volatility in marks is commensurately lower than for liquid BSL.
BDCs and private funds: It surprises many to learn that corporate direct lending as a market has grown only marginally from its $500 billion size 20 years ago. What’s transformative is its migration off the balance sheets of large independent finance companies into private credit funds post-GFC, and further into booming BDCs over the past 10 years. (Remarkably, BDCs hold almost half of direct loans.) This parallels the shift of real estate assets in the 1990s into REITs (which, like BDCs, are a publicly registered transparent vehicle suited to exchange listings and retail investing).
BDCs mostly invest in floating-rate direct loans and are legally restricted to 2-to-1 debt leverage – although they typically carry a more-conservative 1-to-1 leverage. Net-levered expected equity returns for strong BDCs are about 10%.
Publicly listed BDCs offer immediate liquidity with elevated price volatility, while private BDCs tend to offer quarterly redemption at book value with more muted price volatility.
BDC unsecured debt and MM CLOs: BDCs are typically financed in two ways:
- Bank facilities and unsecured corporate bonds
- MM CLOs in the capital markets
BDC debt has ballooned in tandem with the growth of the market and is less familiar – both are technicals that favor current investors. Unsecured bonds have stable BBB ratings, and five-year notes are available in size at 2% to 3% over Treasuries, with minimal credit risk and moderate price volatility. MM CLOs are structurally similar to BSL CLOs, yet favorable technicals allow spreads over SOFR that can be 1% to 2% higher than comparably rated BSL CLO, with less leverage, more muted price volatility, and good ratings stability.
Consumer and other lending and the ABS market
Over the past decade, investors have focused on corporate direct lending. However, nonbank consumer and other lending outstanding in the U.S. (at least $1.5 trillion) is considerably larger. In addition, independent lender balance sheets have grown over the past five years at the same blistering pace (15% annually) as BDCs and MM CLOs, driven both by demand and a strengthened competitive margin as banks retreat. Large parts of the ABS market – public and private placement – grow at even faster rates. The disparate and unfamiliar nature of this lending shows as a dimmer landscape vs. the bright light shone on corporate and mortgage lending (although this may be changing).
There are more than 30 distinct consumer and other lending segments: auto loan and lease, variants of equipment lease, small business, specialized commercial, insurance-linked, personal consumer loan, credit card, student loan, data center, fiber, cell tower, tax lien, net lease, solar, floorplan, handset, catastrophe risk, and more. Independent lenders are typically private companies in concentrated industries, longtime profitable stalwarts in their specialized segments that finance themselves privately with bank lines and ABS in the capital markets.
A good part of the challenge of investing in this market is just knowing what and where it is. Those investors with experience in this market and its rewards would likely prefer it just stay that way.
ABS
Though much less levered than banks, independent finance companies also naturally rely on access to dependable bank and capital markets debt financing. The primary financing is ABS, supplemented by bank warehouse lines.
Approximately $1 trillion in ABS is outstanding across more than 30 asset types – only a small fraction of which is visible in the bond indices. Although collateralized by plentiful asset types, ABS can be grouped into three categories:
- Public and 144A traditional ABS (prime auto, credit card, and student loans): These are larger in size (often over $1 billion), have one or two dozen issuers and several dozen institutional investors, and are rated.
- Public and 144A nontraditional ABS: These are typically smaller ($150 million to $500 million) in size and have a half-dozen or so issuers per asset type and just one or two dozen insurance and money manager investors.
- Private placement ABS: These range across different asset types, structures, and sizes ($100 million to more than $2 billion), but all are Regulation D private placements with a small club of one to six insurer investors.
ABS can have appealing attributes to investors: exceptional carry, mostly investment grade ratings, minimal default and downgrade history, minimal call and prepayment risk, short rate and spread durations, deleveraging through amortization, a good bid from insurers, and low return volatility and beta2 to credit markets.
Traditional ABS, major-rated with more investors and shrinking or stable supply, offer attractive yields of 0.5% to 1.5% over Treasuries for AAA to BBB bonds. Nontraditional ABS, with highly favorable demand and supply technical, often offer outstanding yields of 1% to 4% for investment grade bonds. Below-investment grade BB tranches can be 5% to 7% over Treasuries. The unrated junior or residual tranches of these transactions, when they are available and in the most stable collateral types, promise some of the highest expected returns available in credit markets – 15% to 25% – with low mark-to-market volatility, albeit with little liquidity.
Purely private Regulation D-issued ABS were historically uncommon, limited to a small corner of the general accounts of a few large U.S. insurers alongside private placement corporates. However, these have recently surged as:
- Issuers expand their placement options
- Large alternatives managers finance their lender acquisitions by securitizing loan assets and placing that ABS with affiliated insurers
- Insurance investors purchase whole loan pools from issuers and structure and securitize them for their portfolios
Rosy assessments of this rapidly growing segment are common, and private ABS does offer issuers and managers significant flexibility beyond the usual dealer channels and structures. That said, investor caution is warranted. In our experience, returns on offer are similar or marginally higher to nontraditional ABS, but there is no liquidity. ABS terms for large acquisition financings can be friendlier to equity than bond buyers. Private deals offer significantly less documentation than 144A and public. Structural novelty is not typically a credit plus.
There are great opportunities available across the stack in many private ABS, as in nontraditional ABS, but alignment of interest, proper structuring, and expertise are critical to assuring similar strong credit performance to the broader ABS market.
Conclusion
Given the diverse investment opportunities in the U.S. NBL market, investors can explore various segments such as residential and commercial mortgages, commercial lending, and consumer and other lending. Each segment offers unique risk and return profiles, with various financing vehicles such as CMBS, CLOs, and ABS providing attractive yields. Investors should carefully consider the specific risks and potential returns associated with each asset type to make informed investment decisions.
The author would like to thank Thomas Brennan, John Ackler, Tim Rourke, Chris Ling, Vaidas Nutautas, and Anthony Sylvester for their contributions to this piece.
Contact Us


1 One basis point is equal to 0.01%.
2 Beta is a measure of a portfolio’s sensitivity to market movements. The beta of the broader equity market, as measured by the S&P 500, is 1.00 (Source: Morningstar).
Brown Brothers Harriman & Co. (“BBH”) may be used to reference the company as a whole and/or its various subsidiaries generally. This material and any products or services may be issued or provided in multiple jurisdictions by duly authorized and regulated subsidiaries. This material is for general information and reference purposes only and does not constitute legal, tax or investment advice and is not intended as an offer to sell, or a solicitation to buy securities, services or investment products. Any reference to tax matters is not intended to be used, and may not be used, for purposes of avoiding penalties under the U.S. Internal Revenue Code, or other applicable tax regimes, or for promotion, marketing or recommendation to third parties. All information has been obtained from sources believed to be reliable, but accuracy is not guaranteed, and reliance should not be placed on the information presented. This material may not be reproduced, copied or transmitted, or any of the content disclosed to third parties, without the permission of BBH. All trademarks and service marks included are the property of BBH or their respective owners. © Brown Brothers Harriman & Co. 2025. All rights reserved. PB-08872-2025-08-28