Investing in Uncertainty

July 18, 2022
  • Private Banking
In the feature article of this issue of InvestorView, BBH Chief Investment Strategist Scott Clemons looks at investing in a perpetual state of uncertainty. He looks at the implications for asset allocation and investment implementation and in the end reminds us that price volatility is the friend of the patient and disciplined investor.

The good news is that the first half of 2022 is over. The year started on a sour note as stubbornly persistent inflation became persistently stubborn, reflecting the release of delayed demand from the worst days of the pandemic, exacerbated further by disrupted supply chains. The Russian invasion of Ukraine in February dealt a further blow to economic sentiment and offered an additional reminder of how very integrated the global supply chain is. Caught between the rock of rising inflation and the hard place of an economy still disrupted by COVID-19, the Federal Reserve hastened to make up for lost time by embarking on the long road to more normal monetary policy. Starting with a modest 25-basis-point1 rate increase in March, the Fed added 50 basis points to the fed funds rate in May. As headline inflation continued to rise, the Fed rounded out the first half with a 75-basis-point hike in June. This last policy change marked the largest single increase in the Fed’s target rate since 1994.

Markets loathe uncertainty, and the hatred in the first half was palpable. Interest rates soared as traders concluded that the Fed was behind the curve on addressing inflation. The 10-year Treasury yield rose from 1.5% in January to a peak of almost 3.5% in mid-June, before settling back to 3.0% at the end of the quarter. With yields so low to begin with, the rise in interest rates (and fall in bond prices) readily swamped any coupon income so that total returns across fixed income asset classes were sharply negative. The ICE BofA U.S. Treasury Index posted a total return of -9.2% for the first half, which, although awful, was still a better showing than returns for municipals (-9.3%), investment grade corporate (-13.9%) or high-yield bonds (-14.0%).

Equities swooned. One index after another fell into bear market territory, traditionally defined as a decline of 20% or more from a previous peak: The tech-heavy Nasdaq fell 20% by March, smaller-capitalization stocks crossed the bear market line in May, and the large-cap S&P 500 joined the bear market club in mid-June. For the full half, the Nasdaq was down 29.2%, the small-cap Russell 2000 dropped 23.5%, and the S&P 500 lost 20.0%. This marks the worst first half of a calendar year for equities since 1970.

There was simply nowhere to hide as investors across the spectrum of investable assets decided that cash was king, despite the price tag of inflation, and nothing else was worth holding. Both stocks and bonds posted negative total returns for the first six months of the year – a rare, but not unprecedented, occurrence. In 529 rolling six-month periods going back to 1978, stocks and bonds posted negative returns only 15 times, captured in the lower left quadrant of the nearby scatter graph. The first half of 2022 was a marked outlier, even within the quadrant, as highlighted by the red data point.


Chart illustrating 529 rolling six-month periods from 1978 to 2022. Stocks and bonds posted negative returns only 15 times, captured in the lower left quadrant. The first half of 2022 was a marked outlier, even within this quadrant. 

If you are in need of the data found in this graph, please contact BBHPrivateBanking@bbh.com.


Good riddance to an awful first half.

The bad news is that the second half of the year has started right where the first half ended. Inflation continues to dominate financial headlines, while the war in Ukraine slogs on abroad, and political tensions at home rise as midterm elections draw nearer. Talk of recession looms large even as the futures market expects the Federal Reserve to continue raising interest rates. A Bloomberg survey of economists pegs the likelihood of a recession in the next 12 months at 33%, up from 15% at the beginning of the year.

The rising likelihood of a recession is undeniable. GDP slipped 1.6% at an annualized pace in the first quarter as inventory overbuilding in late 2021 sapped production early in the year. Worryingly, the Atlanta Federal Reserve’s estimate of “real-time” GDP now indicates another modest drop of 1.2% in the second quarter, which would meet the colloquial definition of a recession as two consecutive quarters of economic contraction. (The initial second quarter GDP release from the Bureau of Economic Analysis is scheduled for July 28.)

Blaming the statistics is the last refuge of economic scoundrels. Nevertheless, regardless of the second quarter GDP print, it is hard to characterize the current environment as a recession when the economy has added 2.7 million jobs over the past six months and wages are rising 5% year over year. Nationwide housing prices are up 14%, on average, just since the beginning of the year, and retail sales are up 8.1%. Headlines notwithstanding, and with all due respect for the widespread uncertainty that dominates the economy, this doesn’t feel like a recession.

But the recession debate is more than mere semantics. Personal consumption accounts for close to 70% of GDP: As goes the consumer, so goes the economy. In turn, consumption depends on both the ability and willingness of people to spend money. Household savings stand at $1.5 trillion, and debt relative to income or assets remains at multidecade lows. Households are in good financial shape, and pocketbooks and wallets are flush with cash. The biggest economic risk now is that confidence falters to an extent that consumers reign in their spending, regardless of the size of their bank accounts.


Chart illustrating current and future expectations in consumer confidence from 1999 to 2022. 

If you are in need of the data found in this graph, please contact BBHPrivateBanking@bbh.com.


In other words, all of the talk about recession can become self-fulfilling if consumer psychology falters. Sentiment surveys offer evidence that this risk is rising. The University of Michigan confidence surveys of current and future expectations reveal that consumers are more worried now than during the early days of the pandemic, or even during the darkest days of the global financial crisis. All the cash in the world won’t drive economic activity if consumers go on strike.

To be clear, we do not anticipate an imminent or sharp recession. The global financial crisis of 2008-2009 was caused by excesses in the housing market that pervaded the financial system. The short recession of 2020 resulted from a (hopefully) once-in-a-lifetime pandemic that wrought unprecedented damage on the global economy. Any recession arising from nervous consumers should be modest, given the financial health that households still enjoy. And, we hasten to note, the Bloomberg survey that places a 33% probability on a recession in the next year necessarily implies a 67% probability of no recession.

All of this adds up to a 100% probability of lingering uncertainty, which poses the obvious question for investors, “What, then, shall we do?” On one hand, we could spend our time and energy polishing our crystal balls and trying to peer a little bit further into the future than our competition in pursuit of an information advantage. The empirical problem with this approach is that no one can do it, at least sustainably. If we have learned nothing over the past few years, surely we have learned that the future is forever an unknowable place. Who had a global pandemic on their bingo card at the start of 2020? Who predicted a land war in Eastern Europe? And who, even if lucky or foresightful enough to anticipate these things, could have further predicted how financial markets responded, and the timing of that response?

This is not to deny the utility of analyzing the current state of affairs and what it implies for the future. We are reminded of Supreme Allied Commander Dwight Eisenhower’s reflections on the chaos of the Normandy landing, a day on which everything that could go wrong, did. Paratroopers airdropped into the wrong spots and lost communication with their commanding officers, landing craft wound up on the wrong beaches, or foundered on sandbars, and those that made it ashore found themselves nowhere near the intended targets. In the wake of the war, Eisenhower readily confessed that the D-Day plans turned out to be worthless. “Planning, however, won the war,” Eisenhower insightfully observed. We may not be able to predict, but we can prepare, and the preparation itself enables us to adapt to changing circumstances.

Therefore, rather than spend our time trying to develop a refined view of a single likely outcome, we would rather learn to invest in a state of perpetual uncertainty. After all, this is the only environment in which we ever invest. History only seems causal and obvious in the rearview mirror.

Implications for Asset Allocation

It is human nature to assume that seismic shifts in the economy or financial markets warrant a concomitant change to asset allocation, and the financial media often fuels this inclination, with constant recommendations to buy this and sell that, in anticipation of the market turning one way or another. Yet both experience and analysis indicate that trying to time turning points is a futile and costly exercise, even before considering the drag that taxes impose on portfolios. The concentration of market returns plus the counterintuitive unpredictability of when those returns will occur makes market timing a fool’s errand.

The average annual return of the S&P 500 since it was created in 1927 is 11.6%. This statistic alone might lead one to conclude that the index usually gains somewhere around 11% in any given year, but in reality this has occurred in only three of the past 94 years (1959, 1968 and 2016). Why? The dispersion of returns around this historical average is quite wide, ranging from an annual loss of 47% in 1931 to a gain of 52% in 1954, and the dispersion is not normally distributed – it doesn’t fit the shape of a bell curve. Furthermore, in any given time period, a small handful of trading sessions disproportionately influences the overall return. Averages are misleading. Equity market returns are concentrated, and therefore, missing only a few days can make all the difference in the world.

Consider the nearby graph of a nominal $100 invested in the S&P 500 on January 1, 1990. Despite four recessions and four bear markets over the intervening period, this investment would have compounded to $1,071 as of June 30, 2022 (not adjusted for inflation). On the other hand, if this hypothetical investor had missed the best 10 days over this entire period, her return would have been only $491. Ten out of 8,188 trading days accounted for 41% of the cumulative return.


Chart illustrating a nominal $100 invested in the S&P 500 on January 1, 1990. Despite four recessions and four bear markets over the intervening period, this investment would have compounded to $1,071 as of June 30, 2022 (not adjusted for inflation). On the other hand, if this hypothetical investor had missed the best 10 days over this entire period, her return would have been only $491. Ten out of 8,188 trading days accounted for 41% of the cumulative return. 

If you are in need of the data found in this graph, please contact BBHPrivateBanking@bbh.com.


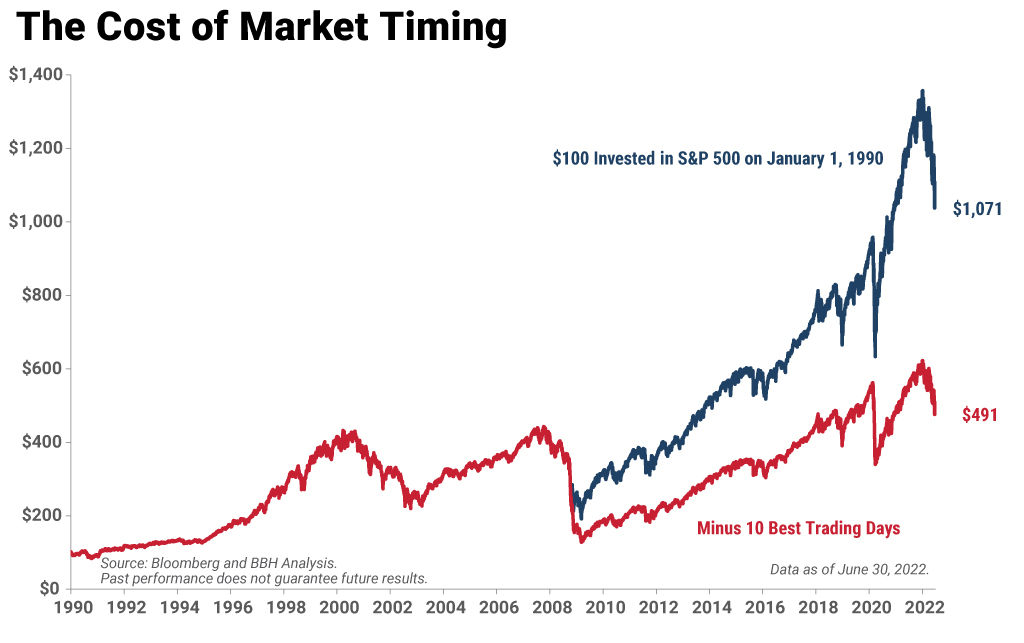
A cynical reader of this analysis might understandably respond, “Ah, but you’ve cherry-picked the 10 best days to remove from the analysis. I wouldn’t be so foolish as to miss out on the best days!” Behavioral psychology argues otherwise. The perverse reality is that all 10 of these days occurred during either the global financial crisis or the early days of the COVID-19 pandemic, amid market environments in which news flow was awful. To make matters worse, many of these “best” days happened in close proximity to the “worst” days, exacerbating the psychological stress of market timing. As a single example, consider the second week of March 2020, when the fog of pandemic uncertainty was settling thickly over the world. The S&P 500 dropped 9.5% on March 12, rebounded 9.3% on March 13, only to fall again by 12% on March 14. U.S. equities looked like an emerging market for a few weeks. Trying to time such concentrated volatility is impossible, and failure is expensive.

Complicating the timing challenge, bear markets usually end well before headlines turn positive. The market bottom in the global financial crisis took place in March 2009, although the government had just raised its stake in Citibank to an unimaginable 36%, evidence that the banking crisis was far from over. The recession continued into the summer of that year, and the unemployment continued to rise through October, touching 10% at the peak. Despite the drumbeat of bad news throughout the year, the S&P 500 rose 68% from the March bottom through the end of 2009.

In the most recent cycle, the market bottomed on March 23, 2020, a date on which the United States was closing its borders to international air travel in order to combat COVID-19, and New York City was building a field hospital in Central Park. There were no vaccines or treatments, and the global economy had all but ground to a halt. Once again, the news flow was apocalyptic. Nevertheless, from that date, the market rallied 70% through the end of the year.

The good news is that ultimately timing isn’t all that important, at least for a long-term investor. Let’s flip the script and consider the hypothetical investment experience of the unluckiest investor imaginable. What if you invested all your money in the S&P 500 the day before the World Health Organization declared COVID-19 a pandemic? Your near-term returns would have looked awful, but patiently holding that stake through June 30, 2022, would have resulted in a total return of 16%, or 9% annualized. Investing in the equity market the day before Lehman Brothers declared bankruptcy would have been similarly painful for close to a year, but you would nonetheless have made 320% since then, or 16% compounded. One last example: Investing all your money into stocks the day before 9/11 yielded a return to date of 420%, or 12% compounded, despite the aftereffects of 9/11, the entirety of the global financial crisis, a worldwide pandemic and whatever we’re going through now.

It's not about timing the market. It’s about time in the market.

The idiosyncrasy of market cycles makes it impossible to identify peaks and bottoms in the moment. Instead, your asset allocation should strategically reflect your liability allocation. What you need your money to do for you (and when) determines how the funds should be allocated, and that allocation should change only if your needs change. For example, if part of your portfolio is needed to meet nearer-term spending needs, those assets are best deployed in shorter-term and higher-quality fixed income, or even cash. These assets offer modest returns but plenty of liquidity. On the other hand, assets intended to fund longer-term needs, such as retirement, legacy spending, philanthropic goals and so forth, need to be protected against inflation, which requires more of an equity exposure.

Market volatility does have implications for rebalancing, as diverging returns may drive asset allocation out of balance. Not only does rebalancing help to restore a long-term strategic allocation, it usually requires an investor to add to assets that have underperformed and perhaps sell assets that have outperformed. The discipline of selling into strength and buying into weakness, although psychologically taxing, is an added ingredient of investment success.

Implications for Investment Allocation

Whereas elevated price volatility and bear markets don’t have a direct implication for asset allocation, market disruptions do influence investment implementation. To be successful in the long run, an investor must assess the fundamental quality of an asset, and then wait for the market to price that asset at an appropriate discount to its intrinsic value. Quality alone is not enough: Buying a good asset at the wrong price is a surefire way to lose money. All else being equal, rising price volatility means that more assets are trading at a discount to their intrinsic values, thereby providing more opportunities for the patient and disciplined investor to exploit the difference between price and value.

The efficient market hypothesis argues that price and value shouldn’t deviate, or, if they do, the difference should be quickly competed away in a market where information is instantly disseminated and rapidly incorporated into prices. This arbitrage increasingly doesn’t even require human action, as algorithms and artificial intelligence can digest news and update price models in a literal blink of an eye. The so-called “strong” form of the efficient market hypothesis therefore concludes that there is no exploitable gap between price and value, and that active management is futile.

Empirical data doesn’t bear this out. From 1990 through 2021, the intra-year price volatility of the S&P 500 has averaged 29.3%, calculated as the difference between the highest and lowest price points of the year, regardless of when they occurred. For comparison, the same analysis of corporate earnings reveals average annual volatility of 19.9%. Stock prices, therefore, show more volatility than earnings, and both show far more volatility than changes in nominal GDP, where the intra-year volatility is a mere 4.0% (even including the sharp drop and recovery of the pandemic). This range of price volatility calls into question how efficient markets actually are. The price of U.S. stocks may fluctuate 29.3% on average, but it is impossible to believe that the underlying value demonstrates similar volatility.

Investor sentiment explains the conundrum. Market prices reflect fundamentals plus the entire range of human emotions – fear, greed, hope, excitement, anger, despair and so on. Markets are ultimately only as efficient as people are. People are generally efficient, but not all the time, and markets are therefore generally efficient, but not all the time. A weaker form of the efficient market hypothesis holds that markets tend toward efficiency over time but that emotions cause prices to overshoot on the upside and the downside, as emotions swing from unbridled optimism to abject despair. Herein lies the opportunity for the patient and disciplined investor in the present market environment.

An old adage in the investment business holds that the secret to success is to buy low and sell high. What this simple adage doesn’t capture is the psychological challenge inherent in this approach. If done correctly, neither action should feel comfortable. We are a herd species; we take comfort in being part of the crowd. To buy what others are selling, or sell what others are buying, is to go against the crowd and stand alone, which is psychologically unsettling. Hence the importance of discipline, which can act as an antidote to the vagaries of human emotion and allow an investor to benefit from price volatility rather than be victimized by it.

Price volatility is the friend of the patient and disciplined investor.

Parting Thoughts

We observed earlier that the 20% drop in the S&P 500 for the first half of 2022 was the worst first half for equities since 1970. The comparison is ominous, as investors rarely look back fondly on the economic or investment environment of the 1970s. The business section of The New York Times for July 1, 1970, offered the following bleak outlook:

At midyear the United States economy is sliding into a recession. Unemployment, which reached 5 per cent of the labor force in May, almost certainly climbed higher in June. With hundreds of thousands of young people entering the job market at a time when employers are laying off workers, unemployment will go higher this summer and threatens to hit 6 per cent by the end of the year. The most disturbing aspect of the immediate economic outlook is the sag in spending on industrial and commercial construction and on inventories. A fall in business investment would turn this mild slump into something more serious.

[New York Times, p. 44, The Economy at Midyear, 1 July 1970.]

Not the most obvious investment environment to say the least. Yet someone who invested in the S&P 500 on the date of this article would have enjoyed a 29% return by the end of the year, 41% over the subsequent full year and 57% over the next three years. Don’t let headlines determine your investment approach. 

Economic uncertainty and market volatility is unpleasant. Yet time and again history demonstrates that price volatility is a feature of financial markets, not a bug, and the ability to withstand the slings and arrows of outrageous ups and downs is essential to long-term investment success.

Keep calm and carry on.

Up Next
Up Next

Diving into Cryptoassets and Blockchain

We speak with Chief Investment Officer Suzanne Brenner and Deputy Chief Investment Officer Justin Reed to get a closer look at blockchain and the cryptoasset ecosystem.

1 One “basis point” is 1/100th of a percent (0.01% or 0.0001).

Brown Brothers Harriman & Co. (“BBH”) may be used as a generic term to reference the company as a whole and/or its various subsidiaries generally. This material and any products or services may be issued or provided in multiple jurisdictions by duly authorized and regulated subsidiaries. This material is for general information and reference purposes only. This material may not be reproduced, copied or transmitted, or any of the content disclosed to third parties, without the permission of BBH. All trademarks and service marks included are the property of BBH or their respective owners. © Brown Brothers Harriman & Co. 2022. All rights reserved. PB-05507-2022-06-27

As of June 15, 2022 Internet Explorer 11 is not supported by BBH.com.

Important Information for Non-U.S. Residents

You are required to read the following important information, which, in conjunction with the Terms and Conditions, governs your use of this website. Your use of this website and its contents constitute your acceptance of this information and those Terms and Conditions. If you do not agree with this information and the Terms and Conditions, you should immediately cease use of this website. The contents of this website have not been prepared for the benefit of investors outside of the United States. This website is not intended as a solicitation of the purchase or sale of any security or other financial instrument or any investment management services for any investor who resides in a jurisdiction other than the United States1. As a general matter, Brown Brothers Harriman & Co. and its subsidiaries (“BBH”) is not licensed or registered to solicit prospective investors and offer investment advisory services in jurisdictions outside of the United States. The information on this website is not intended to be distributed to, directed at or used by any person or entity in any jurisdiction or country where such distribution or use would be contrary to law or regulation. Persons in respect of whom such prohibitions apply must not access the website.  Under certain circumstances, BBH may provide services to investors located outside of the United States in accordance with applicable law. The conditions under which such services may be provided will be analyzed on a case-by-case basis by BBH. BBH will only accept investors from such jurisdictions or countries where it has made a determination that such an arrangement or relationship is permissible under the laws of that jurisdiction or country. The existence of this website is not intended to be a substitute for the type of analysis described above and is not intended as a solicitation of or recommendation to any prospective investor, including those located outside of the United States. Certain BBH products or services may not be available in certain jurisdictions. By choosing to access this website from any location other than the United States, you accept full responsibility for compliance with all local laws. The website contains content that has been obtained from sources that BBH believes to be reliable as of the date presented; however, BBH cannot guarantee the accuracy of such content, assure its completeness, or warrant that such information will not be changed. The content contained herein is current as of the date of issuance and is subject to change without notice. The website’s content does not constitute investment advice and should not be used as the basis for any investment decision. There is no guarantee that any investment objectives, expectations, targets described in this website or the  performance or profitability of any investment will be achieved. You understand that investing in securities and other financial instruments involves risks that may affect the value of the securities and may result in losses, including the potential loss of the principal invested, and you assume and are able to bear all such risks.  In no event shall BBH or any other affiliated party be liable for any direct, incidental, special, consequential, indirect, lost profits, loss of business or data, or punitive damages arising out of your use of this website. By clicking accept, you confirm that you accept  to the above Important Information along with Terms and Conditions.

 
1BBH sponsors UCITS Funds registered in Luxembourg, in certain jurisdictions. For information on those funds, please see bbhluxembourgfunds.com


captcha image

Type in the word seen on the picture

I am a current investor in another jurisdiction