

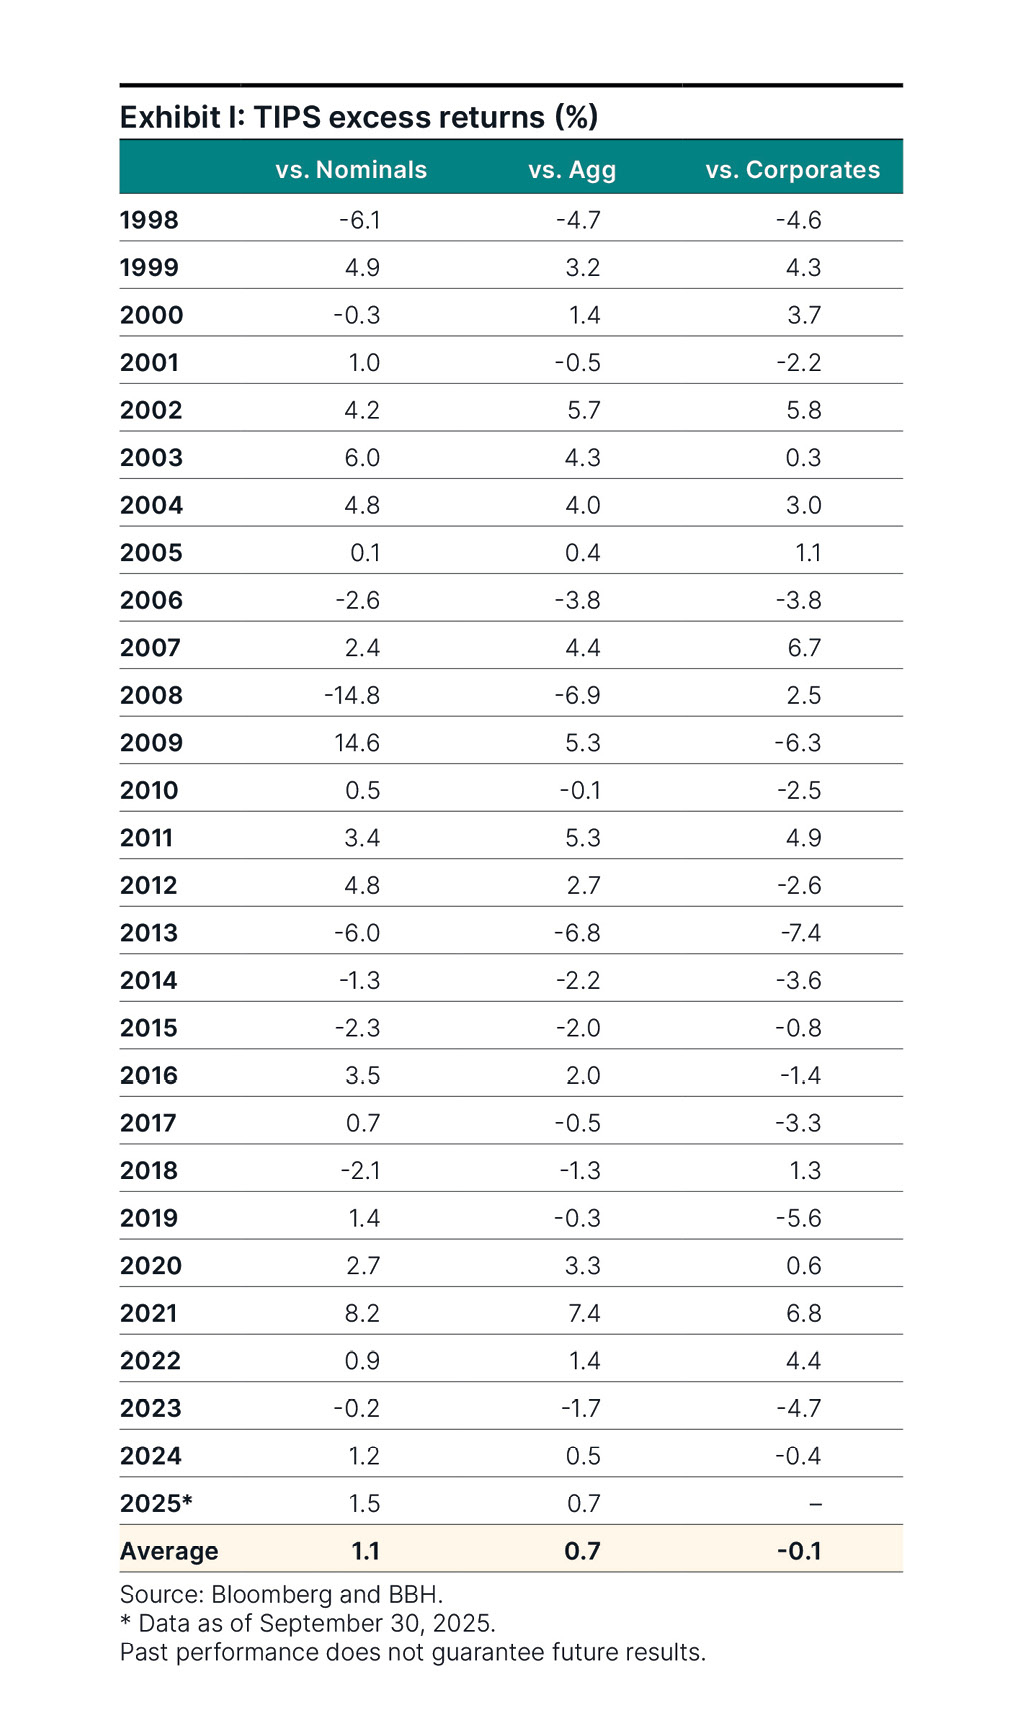
Table showing the TIPS excess returns vs. nominals, the Bloomberg U.S. Aggregate Index, and corporates from 1998 through September 30, 2025. The average performance was 1.1%, 0.7%, and -0.1%, respectively.
Treasury Inflation-Protected Securities (TIPS) spent their first 20 years in relative obscurity, until the post-pandemic inflation surge called them into action. In response, TIPS outperformed other fixed income asset classes in 2020, 2021, and 2022. In the first three quarters of 2025, as economic policy uncertainty and inflationary concerns increased, TIPS once again outperformed across fixed income. While protection from unanticipated inflation is what the eye can see, the value of TIPS goes far beyond the obvious.
Since 1998, on average, TIPS have outperformed nominal Treasuries (nominals) by 1.1% per year, the Bloomberg U.S. Aggregate Index (the Agg) by 0.7% per year, and have kept pace with investment grade corporate bonds (corporates), trailing by 0.1% per year, as seen in Exhibit I. Here, we will review the fundamental features of TIPS and their remarkable performance relative to fixed income assets, and present a simple framework to measure them against nominals and corporates.
The basics
The U.S. Treasury auctioned TIPS for the first time in January 1997. Starting with $7 billion in 10-year notes, TIPS evolved into a $2 trillion market spanning across maturities. TIPS compensate investors for the impact of unanticipated inflation: The size of the principal increases in proportion to inflation, lifting coupon payments as they are calculated off the inflation-adjusted principal. Here are three additional features of TIPS:
- Indexation lag: Cash flows are indexed to the non-seasonally adjusted Consumer Price Index (CPI), published monthly by the Bureau of Labor Statistics. This introduces a two-month inflation indexation lag. For example, in early September, the most recent known inflation rate is July’s, because August’s inflation is unknown until mid-September.1
- Pricing: TIPS nominal cash flows require future inflation but using real rates – excluding inflation – they can be priced like standard fixed-coupon bonds, with accreted inflation added at settlement.
- Deflation and taxation: At maturity, TIPS pay the greater of par and inflation-adjusted par. This embedded floor protects investors against the risk of deflation. Interest payments and inflation accruals are subject to federal taxes but exempt from state and local taxes.
Pricing TIPS in real terms created a market for real interest rates and market-implied inflation expectations. A TIPS investor earns a real yield plus accrued inflation, while an investor in nominals earns a nominal yield. Subtracting the real rate from the nominal rate, we obtain the market-implied expected inflation, or breakeven inflation rate (the additional yield an investor requires to be indifferent between TIPS and nominals).
The difference between realized inflation and breakeven inflation is known as excess inflation. Before COVID-19, it averaged 0.2%, but the inflation surge brought it to 0.5%, showing that investors have consistently underestimated realized inflation.
Breakeven inflation is also useful to track the performance of TIPS relative to nominals. When breakeven inflation increases, TIPS usually outperform nominals. This occurs either when real yields fall more than nominal yields, causing TIPS to appreciate more than nominals – or when real yields rise less quickly than nominal yields, causing TIPS to depreciate less than nominals.
Performance
TIPS delivered strong performance since their inception. As an inflation hedge, the post-pandemic inflation surge was the ultimate test, and TIPS passed with flying colors, finishing ahead of nominals, the Agg, and corporate bonds in 2020, 2021, and 2022, as seen in Exhibit II.
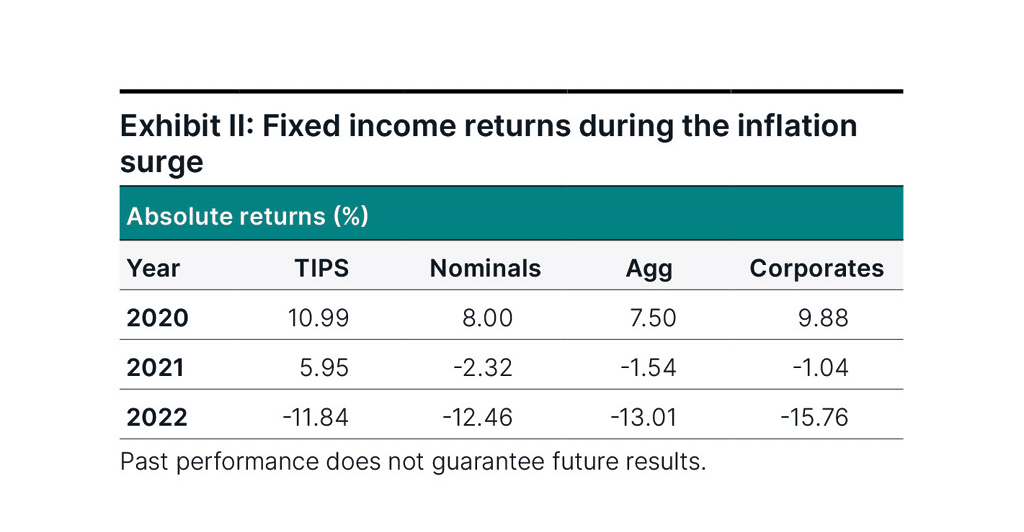
Table depicting fixed income absolute returns during inflation surges in 2020, 2021, and 2022 across TIPS, nominals, the Agg., and corporates. TIPS finished ahead of nominals, Agg., and corporates in all three years, returning 10.99%, 5.95%, and -11.84%, respectively.
During the Great Tightening of 2022,2 the Fed raised the policy rate by 425 basis points (bps)3 between March and December. The resulting increase in rates caused fixed income assets to deliver negative absolute returns (Exhibit II). The same year, TIPS accrued 7.7% in inflation compensation, which offset some of the drag from rising rates, and pulled them ahead of other fixed income asset classes.
In the first three quarters of 2025, TIPS outperformed nominals by 1.5%, the Agg by 0.7%, and matched corporates. Their ability to outperform other fixed income assets makes them an attractive option for investors seeking inflation protection and diversification.
What drives this behavior? TIPS represent about 8% of total Treasuries outstanding, but with a smaller investor base. As a result, TIPS carry a modest liquidity premium relative to nominals. In risk-on years, this premium gives them an advantage over nominals. Because they bear no credit risk, TIPS tend to outperform corporates during risk-off episodes. In this way, TIPS occupy an attractive position: ahead of corporates in risk-off years, and ahead of nominals in risk-on years.
Their ability to outperform other fixed income assets makes [TIPS] an attractive option for investors seeking inflation protection and diversification."
Evaluating TIPS, nominals, and corporates
A bond’s total return is the sum of income and price returns. Consider the 10-year maturity point, where the real yield is 1.7% and breakeven inflation is 2.3%. Using 0.3% for excess inflation, next year’s inflation compensation becomes 2.6%, making TIPS income return 4.3%. For nominals, income return becomes 4.0%, and after adding the credit spread, the income return for corporates becomes 4.8%. (See Exhibit III.)
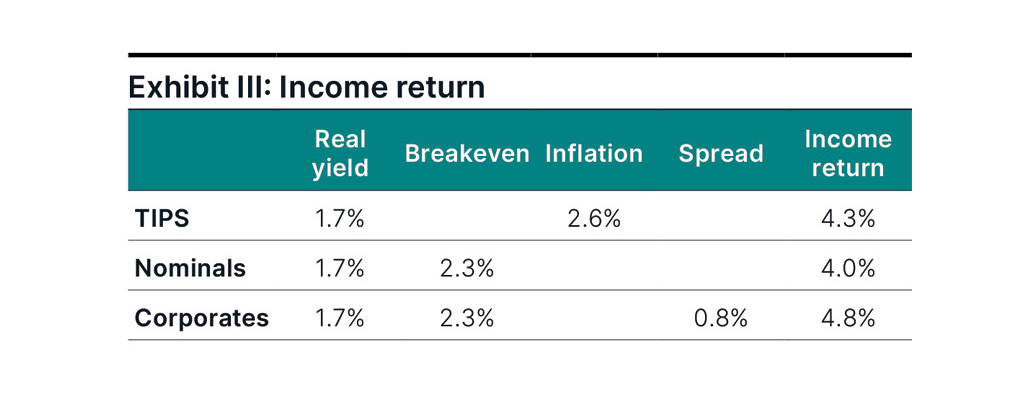
Table depicting the real yield, breakeven, inflation, spread, and income return for TIPS, nominals, and corporates. The income return is 4.3%, 4.0%, and 4.8%, respectively.
Price returns are driven by the changes in real yield, breakeven inflation, and the credit spread. Since the change in real yield affects all assets, its impact cancels out in relative comparisons. Note in Exhibit IV(a) that breakeven inflation at 2.3% is somewhat above its long-term level. Drifting back toward 2% would benefit nominals and corporates over TIPS. However, current levels of policy uncertainty have increased breakevens recently and they could increase even further, benefiting TIPS. Given these conflicting trends, we will assume breakevens stay around current levels for this exercise.
Exhibit IV(b) shows the credit spread at levels near its all-time tight, with almost no room to tighten further, suggesting a spread widening is more likely. According to our corporate valuation framework, a spread widening from current levels to average levels could detract about 2.0% from corporate performance over the next year.
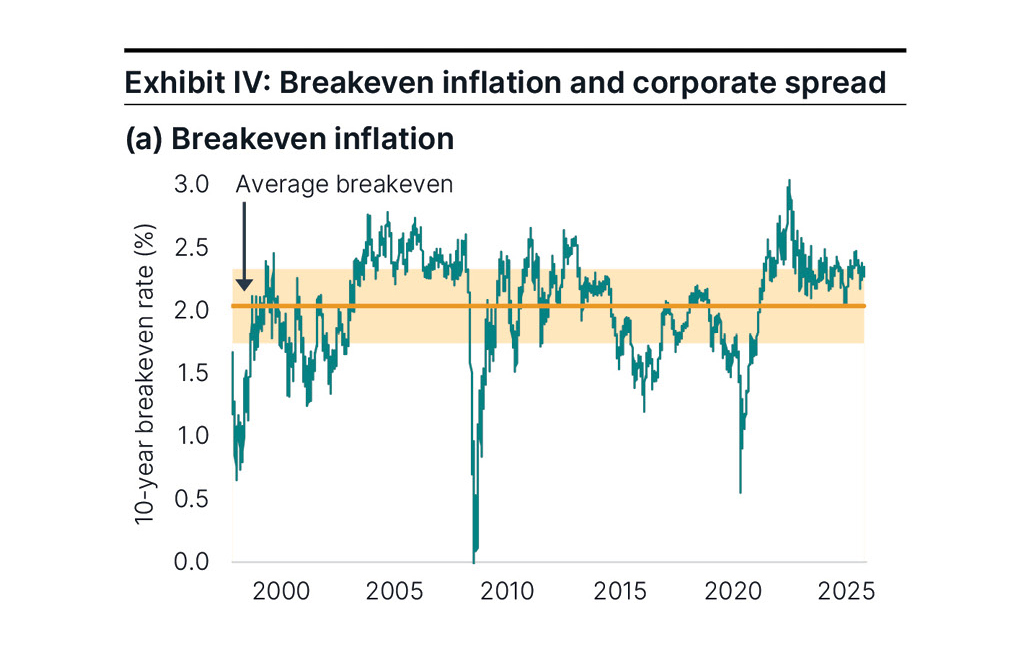
Graph depicting the 10-year breakeven rate and the average breakeven through YTD 2025. Breakeven inflation is at 2.3%, somewhat above its long-term level.
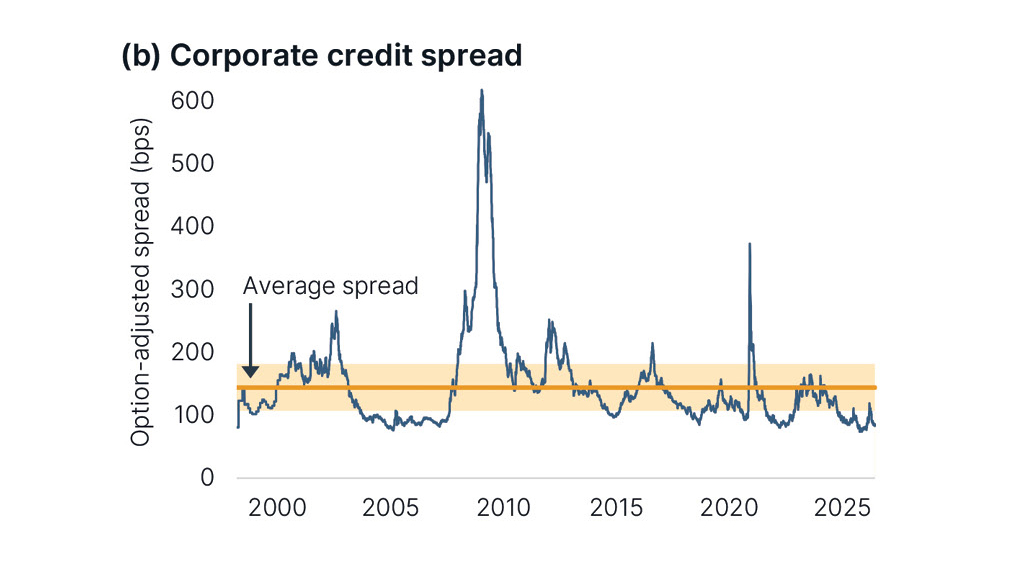
Graph depicting the corporate credit spread and the average spread through YTD 2025. The credit spread is at levels near its all-time tight, suggesting a spread-widening is likely.
With breakeven inflation unchanged and spreads likely to widen over the next year, we estimate total returns of 4.3%, 4.0%, and 2.8% for TIPS, nominals, and corporate bonds. Although corporates dominate in income, the potential spread-widening makes them less attractive than nominals or TIPS over the next year, as shown in Exhibit V.
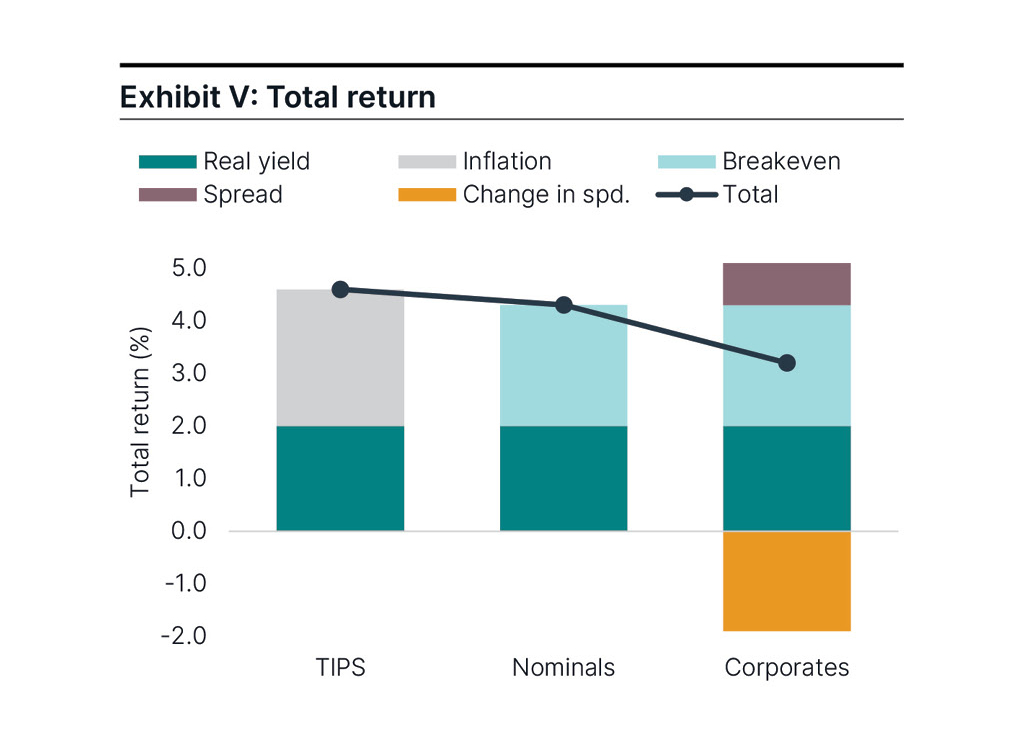
Graphic depicting the total returns of TIPS, nominals, and corporate bonds between real yields, inflation, breakevens, spreads, and change spreads. With breakeven inflation unchanged over the next year, we estimate total returns of 4.3%, 4.0%, and 2.8% for TIPS, nominals, and corporate bonds.
Key takeaways
TIPS have come a long way from their quiet beginnings. The post-pandemic inflation surge reminded investors of their core purpose – protecting capital from inflation – while a longer-term perspective revealed their broader strengths. Since their inception, TIPS have outperformed nominal Treasuries and the Agg, and kept pace with corporate bonds, even though TIPS do not bear credit risk.
In these uncertain times, TIPS provide a unique hedge: as the Fed lowers the policy rate, real yields tend to fall, supporting TIPS prices. If inflation accelerates, TIPS outperform nominal Treasuries via inflation accruals and breakeven widening. Furthermore, their performance across different market regimes makes them an attractive source of long-term value relative to other fixed income instruments.
To learn more about TIPS, reach out to the BBH Fixed Income team or your BBH relationship team.
Contact Us


1 Some refer to a three-month lag because September’s inflation accrual calculation needs to look back at July’s inflation, which requires June’s CPI level.
2 The Great Tightening refers to a period of aggressive monetary policy tightening initiated by the Fed in 2022 in response to rising inflation.
3 One basis point is equal to 0.01%.
Index performance is not illustrative of the performance of any BBH investment product. An investment cannot be made directly in any index.
Risks
Investors should be able to withstand short-term fluctuations in the equity and fixed income markets in return for potentially higher returns over the long term. The value of portfolios changes every day and can be affected by changes in interest rates, general market conditions and other political, social and economic developments.
NOT FDIC INSURED NO BANK GUARANTEE MAY LOSE VALUE
Opinions, forecasts, and discussions about investment strategies represent the authors’ views as of the date of this commentary and are subject to change without notice. References to specific securities, asset classes, and financial markets are for illustrative purposes only and are not intended to be and should not be interpreted as recommendations. Brown Brothers Harriman & Co. (“BBH”) may be used as a generic term to reference the company as a whole and/or its various subsidiaries generally. This material and any products or services may be issued or provided in multiple jurisdictions by duly authorized and regulated subsidiaries. This material is for general information and reference purposes only and does not constitute legal, tax or investment advice and is not intended as an offer to sell, or a solicitation to buy securities, services or investment products. Any reference to tax matters is not intended to be used, and may not be used, for purposes of avoiding penalties under the U.S. Internal Revenue Code, or other applicable tax regimes, or for promotion, marketing or recommendation to third parties. All information has been obtained from sources believed to be reliable, but accuracy is not guaranteed, and reliance should not be placed on the information presented. This material may not be reproduced, copied or transmitted, or any of the content disclosed to third parties, without the permission of BBH. All trademarks and service marks included are the property of BBH or their respective owners. © Brown Brothers Harriman & Co. 2025. All rights reserved.
IM-17490-2025-10-29 Exp. Date 9/30/2027