

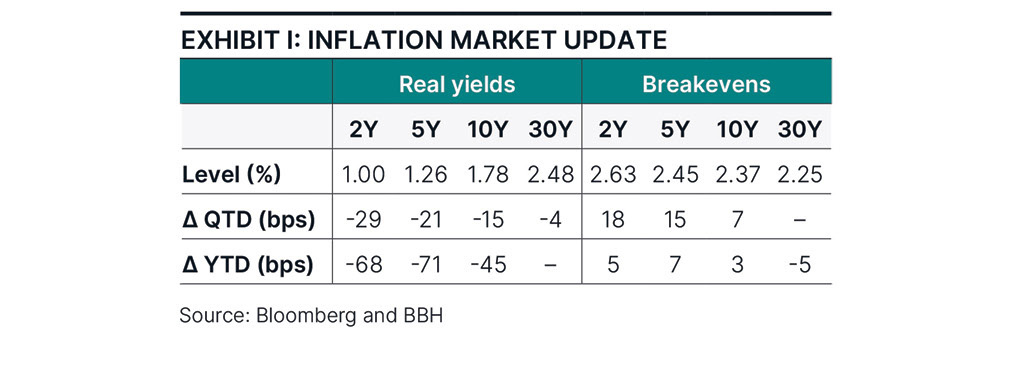
Exhibit 1: Table depicting the quarter-to-date and year-to-date change in the two-, five-, 10-, and 30-year real yields and breakevens. In Q3 2025 the front end of the real yield curve rallied more than 20 basis points (bps) , while the 10-year part of the curve rallied by 15 bps. Breakevens increased, especially in the front end.
Highlights
|
Managing Risks
In the third quarter of 2025, inflation increased as some tariff-induced price pressures kept near-term momentum firm, and the labor market showed downside risks to employment. In response, the Federal Reserve (Fed) cut the policy rate for the first time in 2025. Chairman Jerome Powell called it a “risk management” cut, as Fed officials walk a fine line between the two legs of the dual mandate, tilting toward maximum employment but staying vigilant for risks to price stability. Overall economic activity remained on solid footing and financial markets continued their recovery from the turmoil experienced early in second quarter of 2025. Real yields rallied, especially short maturities, and interest rate volatility continued to fall.
Market update
In 3Q25, the front end of the real yield curve rallied more than 20 basis points (bps)1, while the 10-year yield rallied by 15 bps. Expectations of easier monetary conditions were the main catalyst. Market-implied inflation expectations, breakevens, increased, especially in the front of the breakeven curve, expressing investors’ concern about inflationary risks.
In another strong quarter, Treasury Inflation-Protected Securities (TIPS) returned 2.10%, bringing year-to-date total returns to 6.86%. For the year, TIPS outperformed nominal Treasuries by 1.50%, and the Bloomberg Aggregate Bond Index by 0.73%. Robust returns and increased inflation risks kept net flows into TIPS-related exchange-traded funds (ETFs) positive for a third consecutive quarter, reaching $12.1 billion for the year, $1.3 billion per month on average.
The Fed lowered the policy rate 25 bps in September, noting that “inflation has moved up and remains somewhat elevated” and that “downside risks to employment have risen.” According to the Summary of Economic Projections, the median policy official expects two more cuts in 2025, and slightly higher economic growth than expected in June.
Positioning and performance
Through our investment process, we build positions based on opportunities available in the universe of investable securities. For TIPS, this universe is comprised of securities maturing in less than one year combined with dozens of securities in the Bloomberg U.S. Treasury Inflation-Linked Bond Index, the benchmark. In Exhibit II(a), our expected returns framework illustrates roll-down opportunities in the intermediate part of the real yield curve. These opportunities resulted from real yield curve steepening during the quarter. Hence, our TIPS allocations concentrate around 10 to 15 positions, several of which are in intermediate tenors.
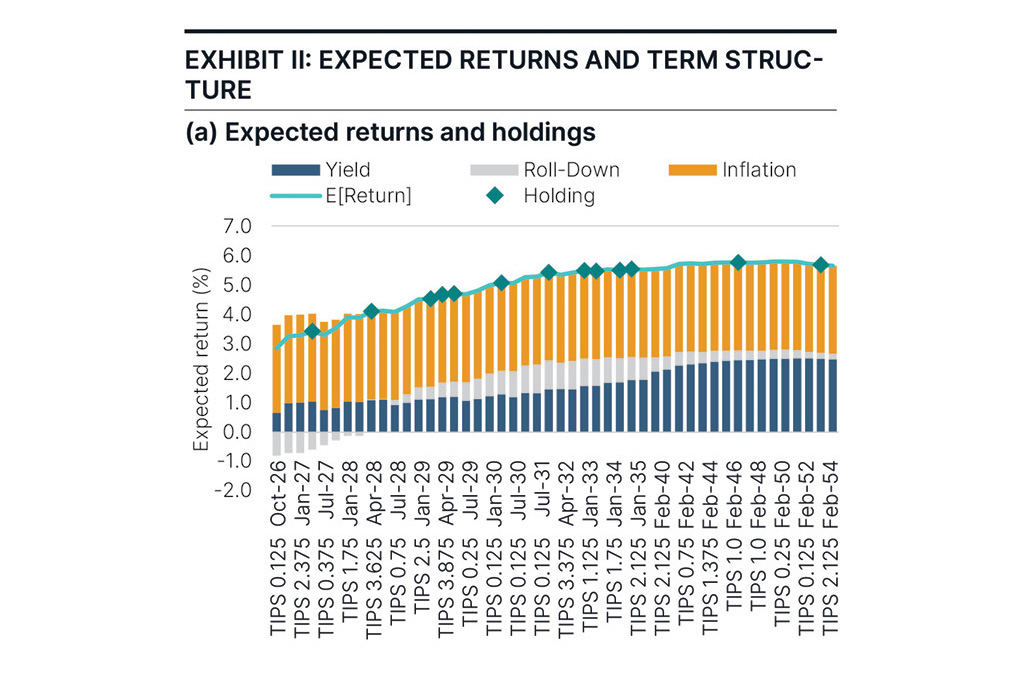
Exhibit 2(a): Chart depicting TIPS’ expected returns and holdings. There are roll-down opportunities in the intermediate part of the real yield curve resulting from the curve steepening during the quarter.
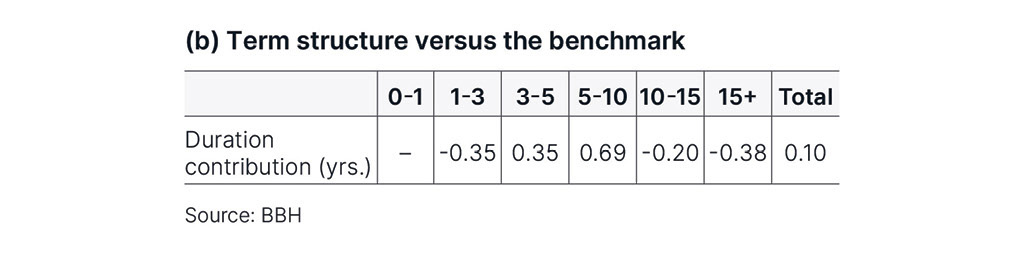
Exhibit 2(b): Table depicting the term structure vs. the benchmark. Our steepening bias favors the intermediate over the long part of the real yield curve and a slight duration overweight relative to the benchmark.
The resulting term structure allocation depicts our steepening bias, favoring the intermediate over the long part of the real yield curve, and a slight duration overweight relative to the benchmark. (Exhibit IIb.) Our positioning detracted from performance in the quarter, bringing year-to-date excess return to 16 bps. Roll-down and duration contributed to performance, while pricing was the main detractor.
Macroeconomic conditions and policy
Economic activity has remained on solid footing. The Bureau of Economic Analysis revised Q2 growth from 3.2% to 3.8%. Real-time estimates of economic growth such as the New York Fed’s Nowcast and the Atlanta Fed’s GDPNow have Q3 growth between 2.5% and 3.9%. Furthermore, the three-month moving average of the Chicago Fed National Activity Index is -0.18, slightly below trend growth, but still above the recession threshold of -0.7.
Labor market weakening persisted in Q3, and with the September labor market report delayed by the U.S. Government shutdown, we do not have an official quarterly figure. Since May, the economy added 107,000 jobs, and private estimates of September job creation, such as ADP, suggest payroll may have deteriorated further. Moreover, following the Quarterly Census of Employment and Wages, the Bureau of Labor Statistics revised down the level of employment from April 2024 to March 2025 by 911,000 jobs. Such downside risks to employment prompted the Fed to consider a gradual easing approach in September, to remove potential restraints off the economy.
Annual headline and core Consumer Price Inflation (CPI) reached 2.9% and 3.1% in August 2025, uncomfortably higher than the Fed’s 2% target. The uptick in short-term momentum is evident annualizing one- and three-month core inflation rates, which reached 4.2% and 3.6%. Looking more closely at core CPI inflation (Exhibit III), services continue to be the main contributor, as they constitute more than 60% of CPI, but the contribution of goods, mostly negative in 2024, has accelerated in recent months in response to price pressures from import tariffs.
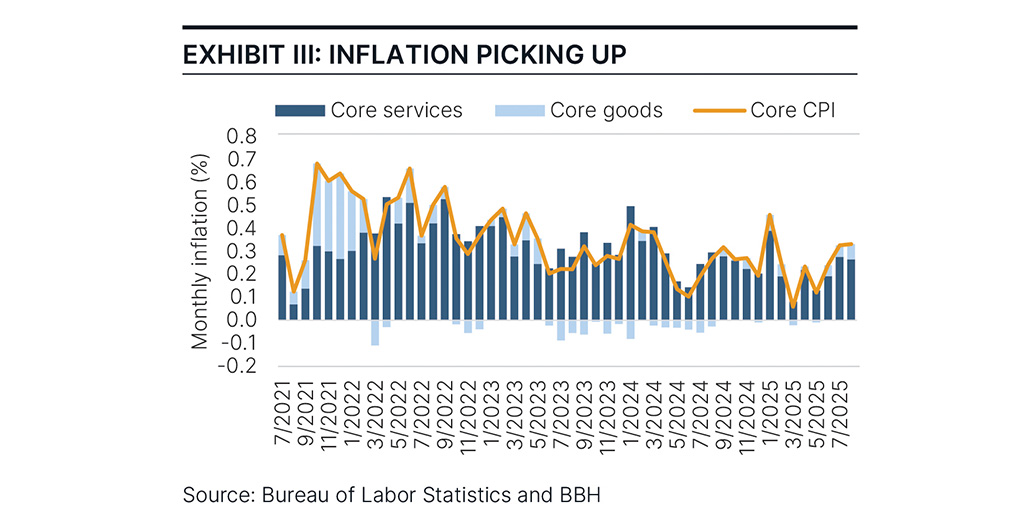
Exhibit 3: Chart depicting Core CPI inflation from 2021 through YTD 2025. Core CPI reached 3.1% in August 2025; services continue to be the main contributor.
Weaker labor markets and increased inflation risks have the Fed on a cautious, data-driven path. The Federal Open Market Committee (FOMC) lowered the range of the policy rate by 25 bps in September to 4.0% to 4.25%. The Summary of Economic Projections showed the median Fed official expects two more cuts in 2025, in line with investors in federal funds futures. The main surprise following the FOMC meeting was the number of dissents. Most Fed observers expected three, following the addition of Stephen Miran to the dovish pair of Governors Bowman and Waller, but Miran’s was the only dissenting vote in favor of a 50-bp cut. The higher-than-expected consensus Chairman Powell managed to achieve was perceived by some as a sign of institutional independence.
Conclusion
Since 1998, on average, TIPS outperformed nominal Treasuries by more than 1% per year, and the Agg by 0.7%. Today, attractive 10-year real yields in the 1.8%-2% range, combined with a positive skew to inflation surprises keep TIPS in contention for strong performance among fixed income asset classes. Furthermore, TIPS benefit from a monetary policy hedge: As the Fed lowers the policy rate, real yields tend to fall, supporting TIPS prices. If inflation re-accelerates, TIPS outperform nominals via inflation accruals and breakeven widening. With significant policy uncertainty still in the background, and the impact of tariffs on imports working its way through prices, upside risks to inflation are material. As the Fed continues to manage the risks to their dual mandate, emphasis on labor market support implies Fed policy will provide less inflation protection, increasing the value of TIPS as an inflation hedge. It is a good time to increase or gain exposure to TIPS.

| Performance As of September 30, 2025 |
|||||||
|---|---|---|---|---|---|---|---|
|
Total Returns |
Average Annual Total Returns |
|||||
Composite/Benchmark |
3 Mo. |
YTD |
1 Yr. |
3 Yr. |
5 Yr. |
10 Yr. | Since Inception |
BBH Inflation-Indexed Securities Composite - gross of fees |
2.07% |
7.02% |
3.92% |
4.86% |
1.38% |
3.04% |
5.09% |
BBH Inflation-Indexed Securities Composite - net of fees |
2.03% |
6.90% |
3.76% |
4.70% |
1.23% |
2.89% |
4.93% |
Bloomberg U.S. TIPS Index |
2.10% |
6.86% |
3.79% |
4.88% |
1.42% |
3.00% |
4.77% |
Returns are not annualized. The Inflation-Indexed Fixed Income Composite inception date is 04/01/1997. Past performance does not guarantee future results.05/01/2002. |
|||||||
| Source: BBH & Co. and Bloomberg | |||||||
1 One basis point is equal to 0.01%.
RISKS
The value of the portfolio can be affected by changes in interest rates, general market conditions and other political, social and economic developments. Each investor should evaluate their ability to invest for the long-term, especially during periods of downturn in the market.
Investing in the bond market is subject to certain risks including market, interest-rate, issuer, credit, maturity, call and inflation risk; investments may be worth more or less than the original cost when redeemed. Bond prices are sensitive to changes in interest rates and a rise in interest rates can cause a decline in their prices.
Foreign investing involves special risks including currency risk, increased volatility, political risks, and differences in auditing and other financial standards.
The Strategy may also invest in derivative instruments, investments whose values depend on the performance of the underlying security, assets, interest rate, index or currency and entail potentially higher volatility and risk of loss compared to traditional bond investments.
Holdings are subject to change. Totals may not sum due to rounding.
The Bloomberg U.S. TIPS Index includes all publicly issued, U.S. Treasury inflation-protected securities that have at least one year remaining to maturity, are rated investment grade, and have $250 million or more of outstanding face value. The index is not available for direct investment.
“Bloomberg®” and the Bloomberg indexes are service marks of Bloomberg Finance L.P. and its affiliates, including Bloomberg Index Services Limited (“BISL”), the administrator of the indexes (collectively, “Bloomberg”) and have been licensed for use for certain purposes by Brown Brothers Harriman & Co (BBH). Bloomberg is not affiliated with BBH, and Bloomberg does not approve, endorse, review, or recommend the BBH Strategy. Bloomberg does not guarantee the timeliness, accurateness, or completeness of any data or information relating to the strategy.
Effective duration is a measure of the portfolio’s return sensitivity to changes in interest rates.
Credits: Obligations such as bonds, notes, loans, leases and other forms of indebtedness, except for Cash and Cash Equivalents, issued by obligors other than the U.S. Government and its agencies, totaled at the level of the ultimate obligor or guarantor of the Obligation.
One basis point or bp is 1/100th of a percent (0.01% or 0.0001).
Holdings and attribution information is of a single representative account (“Representative Account”) that invests in the strategy. It is managed with the same investment objectives and employs substantially the same investment philosophy and processes as the Inflation-Indexed Fixed Income Strategy.
Brown Brothers Harriman Investment Management (“IM”), a division of Brown Brothers Harriman & Co (“BBH”), claims compliance with the Global Investment Performance Standards (GIPS®). GIPS® is a registered trademark of CFA Institute. CFA Institute does not endorse or promote this organization, nor does it warrant the accuracy or quality of the content contained herein.
To receive additional information regarding IM, including a GIPS Composite Report for the strategy, contact John W. Ackler at 212 493-8247 or via email at john.ackler@bbh.com.
Gross of fee performance results for this composite do not reflect the deduction of investment advisory fees. Net of fees performance results reflect the deduction of the maximum investment advisory fees. Returns include all dividends and interest, other income, realized and unrealized gain, are net of all brokerage commissions, execution costs, and without provision for federal or state income taxes. Results will vary among client accounts. Performance calculated in U.S. dollars.
The objective of our Inflation-Indexed Fixed Income Strategy is to deliver excellent returns in excess of industry benchmarks through market cycles. The Composite included all fully discretionary, fee-paying domestic accounts over $10 million with an emphasis on U.S. inflation indexed securities. May invest up to approximately 25% outside of U.S. inflation indexed securities, and a duration of approximately 7-9 years. Accounts that subsequently fall below $9.25 million are excluded from the Composite.
There is no assurance the investment objectives will be achieved.
Brown Brothers Harriman & Co. (“BBH”) may be used to reference the company as a whole and/or its various subsidiaries generally. This material and any products or services may be issued or provided in multiple jurisdictions by duly authorized and regulated subsidiaries. This material is for general information and reference purposes only and does not constitute legal, tax or investment advice and is not intended as an offer to sell, or a solicitation to buy securities, services or investment products. Any reference s tax matters is not intended to be used, and may not be used, for purposes of avoiding penalties under the U.S. Internal Revenue Code, or other applicable tax regimes, or for promotion, marketing or recommendation to third parties. All information has been obtained from sources believed to be reliable, but accuracy is not guaranteed, and reliance should not be placed on the information presented. This material may not be reproduced, copied or transmitted, or any of the content disclosed to third parties, without the permission of BBH. All trademarks and service marks included are the property of BBH or their respective owners. © Brown Brothers Harriman & Co. 2025. All rights reserved.
NOT FDIC INSURED NO BANK GUARANTEE MAY LOSE VALUE
IM-17354-2025-10-14 Exp. Date 01/31/2026