

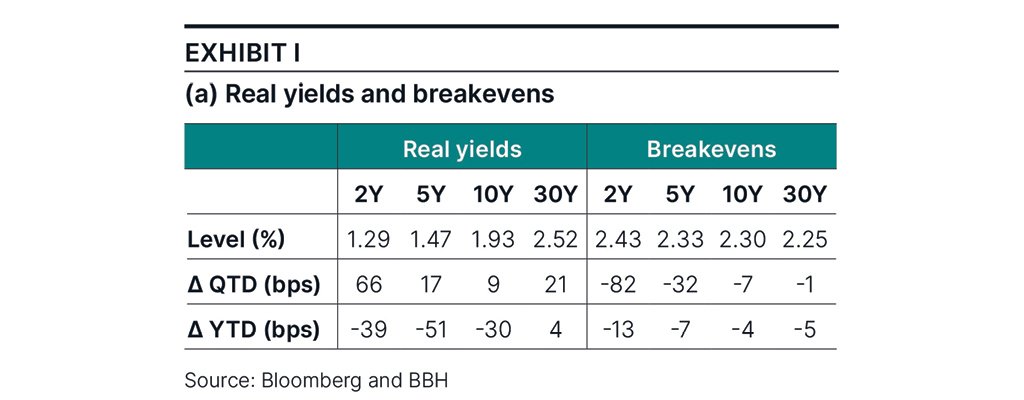
Table showing the Q2 and year-to-date change in the two-, five-, 10-, and 30-year yields and breakevens.
Highlights
|
A Quarter to Remember
Not every quarter begins by rewinding the terms of trade to the 1930s. The shock – a fundamental change of the economic order – sparked frenetic trading sessions across global financial markets. Calm did not prevail until the White House announced a 90-day pause on tariff implementation. But global trade turmoil was just the beginning. Debates over deficit-financed tax and spending measures ignited debt-sustainability concerns, and Moody’s stripped the U.S. of its coveted triple-A credit rating. To top it off, geopolitical risk surged as the goal of a quick peace agreement in Ukraine failed to materialize, and tensions in the Middle East culminated in U.S. airstrikes on Iranian nuclear facilities, sealing Q2 2025 as one memorable quarter.
The April 2, 2025, tariff announcement pushed policy uncertainty to unprecedented levels. As in prior risk-off episodes, Treasury yields initially rallied. But once investors repriced institutional risk and reassessed potential damage to U.S. policy credibility, Treasuries sold off. In just days, both nominal and real 10-year yields rose 50 basis points (bps)1. Exhibit I shows a modest quarterly change of +9bps in the 10-year real yield, but this move disguises the underlying volatility: The magnitude of daily yield movements in Q2 totaled 276bps, well above Q1’s 198bps. (Exhibit Ib.)
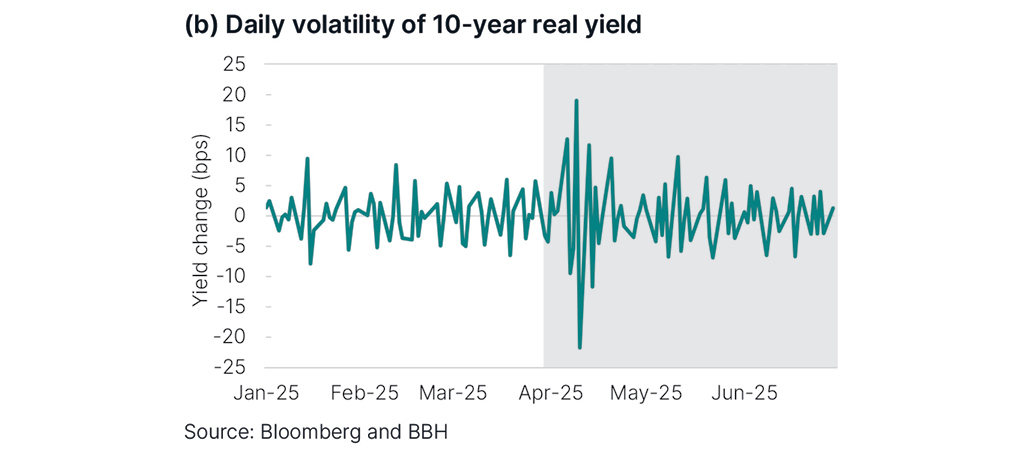
Magnitude of total 10-year real yield daily swings in Q2 totaled 276 bps, well above Q1, while longer-maturity breakevens remained almost unchanged in Q2.
Market-implied inflation expectations, breakevens, reversed most of the increase experienced since the 2024 election. In the absence of any impact from tariffs on realized inflation, breakevens drifted down, especially shorter maturities. Longer-maturity breakevens, which reflect inflation expectations over the long term plus an inflation risk premium, remained almost unchanged in Q2.
Treasury Inflation-Protected Securities (TIPS) returned 0.48% in Q2 2025, bringing the year-to-date total return to 4.67%. In 2025, TIPS outperformed nominal Treasuries by 0.88%, the Bloomberg Aggregate Bond Index (Agg) by 0.65%, and investment-grade corporate bonds by 0.50%. Sustained outperformance and perceived inflation risks kept net flows into TIPS-related exchange traded funds positive for a second consecutive quarter, reaching $7.3 billion for the year.
The Federal Reserve (Fed) held rates steady throughout Q2. Some Fed officials expressed their willingness to lower rates as soon as July, but most members of the Federal Open Market Committee (FOMC) stood behind Chair Jerome Powell’s patient and data-driven approach. By quarter end, investors in fed fund futures markets priced two rate cuts by December 2025 and almost 125bps in cuts over the next 12 months. For comparison, at the beginning of 2025, investors priced 43bps in cuts for the year.
Positioning and performance
The Bloomberg U.S. Treasury Inflation-Linked Bond Index, the benchmark, represents TIPS with at least one year until final maturity. Our expected returns framework, illustrated in Exhibit IIa, shows the sources of value across these securities. Note that in addition to real yield, roll-down and inflation are important sources of expected return. Inflation contributes to each bond’s expected return equally, not giving an advantage to any one of them over the others. Roll-down return depends on the slope of the real yield curve, which ranged between 40bps and 50bps in Q2, in contrast to -40bps two years ago. Therefore, today’s 10- to-15 positions underlying our strategies, concentrate in the intermediate part of the curve, maximizing roll-down opportunities.
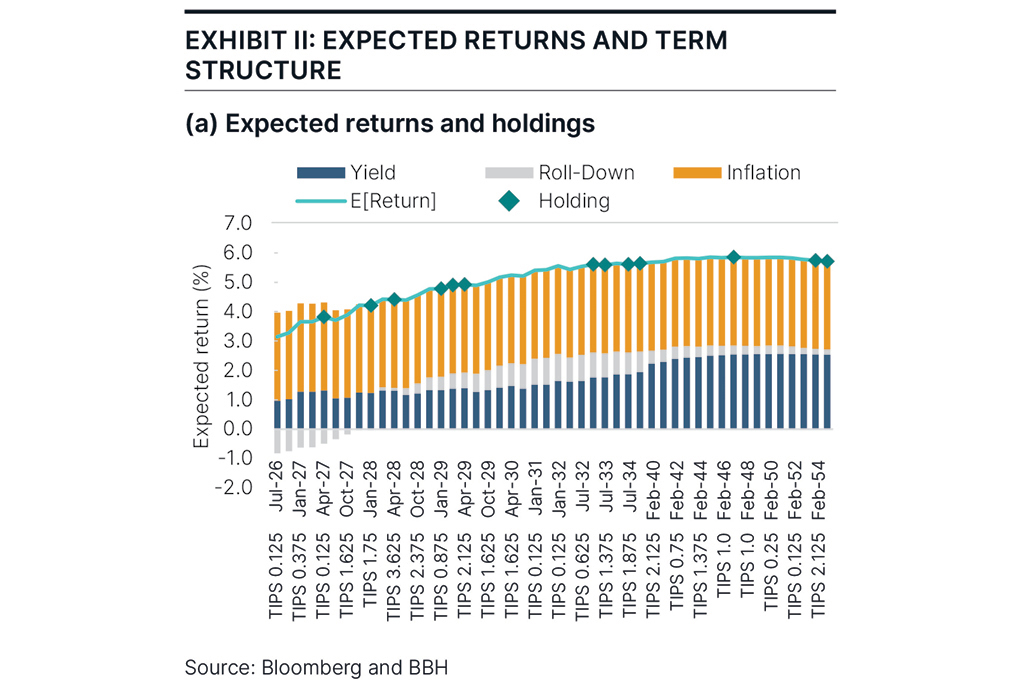
Chart depicting the expected returns framework which shows the sources of value across TIPS securities. Real yield, rolldown, and inflation are important sources of expected return.
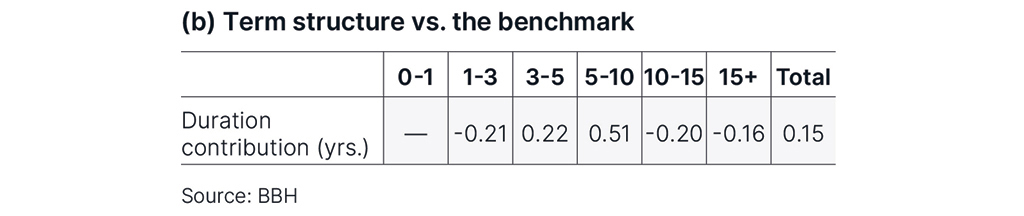
Table depicting the term structure vs. the benchmark. The shift from short to intermediate maturities extended the portfolio’s duration slightly ahead of the benchmark.
The resulting term structure positioning depicts a curve steepener between the intermediate and long parts of the real yield curve. Furthermore, the shift from short to intermediate maturities extended the portfolio’s duration slightly ahead of the benchmark’s duration, as seen in Exhibit IIb.
Our positioning generated 7bps of performance over the benchmark in Q2, bringing year-to-date excess return to 19bps. Both roll-down and duration have contributed to performance.
Macroeconomic conditions and policy
Economic policy uncertainty has declined from its all-time high, closing some of the gap between sentiment and hard economic data. In addition to sentiment improving, the economy remained growing throughout Q2. The New York Fed’s Nowcast, a real-time estimate of economic growth, averaged 2.3%.
The labor market added 449,000 jobs in Q2, bringing the first-half 2025 total to 782,000. Although these levels are on track with average job creation in the last 12 months, they are far behind first-half 2024, when the economy added almost one million jobs. Furthermore, the details of the most recent report illustrate a more nuanced picture. For instance, of the 147,000 jobs added in June, only 83,000 jobs are in the private sector, and 59,000 of them are in the healthcare sector.
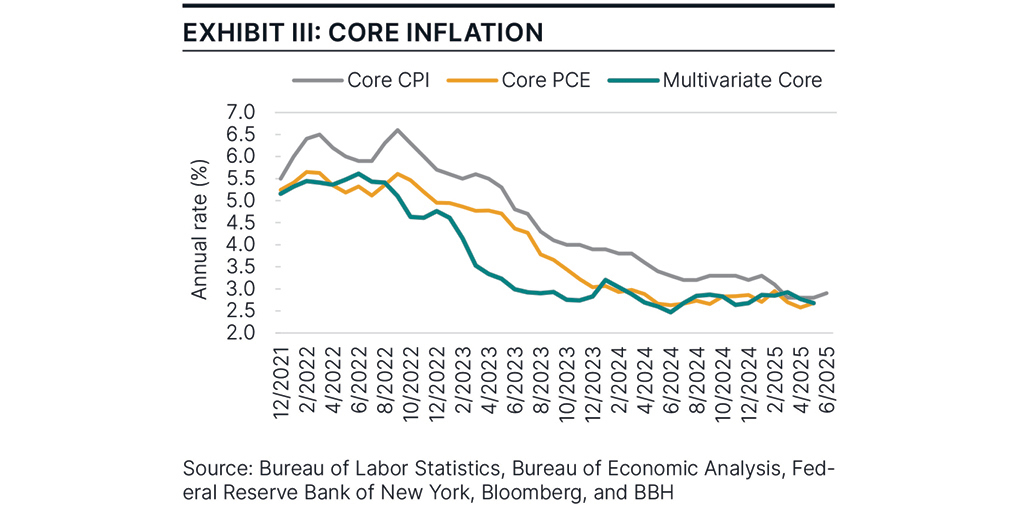
Chart depicting realized annual core inflation across multivariate core, core CPI, and core PCE. Realized annual core inflation has stayed between 2.7% and 3% for several months.
The anticipated inflationary impact of tariffs has been muted thus far. Realized annual core inflation has stayed between 2.7% and 3% for several months. One reason might be that suppliers accumulated inventories in Q1 and can offer goods at prices that still reflect pre-tariff costs. It is also possible that businesses are not fully passing through their higher costs to consumers while the final trade regime remains uncertain. Both survey-based and market-implied measures of short-term inflation expectations had risen before April, but once the White House announced the 90-day pause in the application of reciprocal tariffs, they moved down closer to 3%.
The housing inflation complex in the Consumer Price Index (CPI), also known as shelter, constitutes more than 45% of core CPI and continues to drive core inflation. It has contributed 0.34% of the 0.42% inflation added in the last three months. Running at an annualized rate of 3.1%, housing inflation has moderated, approaching its 3% pre-COVID long-term average.
The Fed is in a difficult position, balancing inflationary risks from tariffs against economic activity signals. Tariffs are taxes that increase the cost of imported goods, which add inflationary risks. Uncertainty about where tariffs will settle postpones business activity, adding risks of an economic slowdown. It might be premature to talk about stagflation, but the preconditions exist. The current wait-and-see mode of the Fed indicates that for now policy makers are focused on guiding inflation toward the 2% target before cutting rates. Chair Powell has acknowledged that rates are “somewhat restrictive” but has not provided guidance on the timing of future cuts. June’s Summary of Economic Projections shows the median FOMC member expects two rate cuts in 2025.
Conclusion
During Q2 2025, TIPS remained strong in turbulent macroeconomic conditions and financial markets full of policy uncertainty. For the year, they remain ahead of nominal Treasuries, the Agg, and investment-grade corporate bonds. Stable long-term breakevens, and positive excess returns cement TIPS as a durable inflation hedge and a stabilizing force within diversified portfolios. With inflation risks far from extinguished, and breakevens trading at discount to realized core inflation, TIPS are well-positioned to absorb volatility while delivering inflation-adjusted income. The term structure remains supportive, and valuations strong. The quarter to remember has reminded investors that protection against inflation uncertainty is essential.
| Performance As of June 30, 2025 |
|||||||
|---|---|---|---|---|---|---|---|
|
Total Returns |
Average Annual Total Returns |
|||||
Composite/benchmark |
3 Mo. |
YTD |
1 Yr. |
3 Yr. |
5 Yr. |
10 Yr. | Since Inception |
BBH Inflation-Indexed Securities Composite - gross of fees |
0.55% |
4.86% |
5.94% |
2.39% |
1.56% |
2.71% |
5.06% |
BBH Inflation-Indexed Securities Composite - net of fees |
0.51% |
4.78% |
5.78% |
2.23% |
1.41% |
2.56% |
4.90% |
Bloomberg U.S. TIPS Index |
0.48% |
4.66% |
5.84% |
2.34% |
1.61% |
2.67% |
4.74% |
Returns of less than one year are not annualized. The Inflation-Indexed Fixed Income Composite inception date is 04/01/1997 Past performance does not guarantee future results. Sources: BBH & Co. and Bloomberg |
|||||||
Authors

1 Basis point (bp) is a unit that is equal to 1/100th of 1% and is used to denote the change in price or yield of a financial instrument.
RISKS
The value of the portfolio can be affected by changes in interest rates, general market conditions and other political, social and economic developments. Each investor should evaluate their ability to invest for the long-term, especially during periods of downturn in the market.
Investing in the bond market is subject to certain risks including market, interest-rate, issuer, credit, maturity, call and inflation risk; investments may be worth more or less than the original cost when redeemed. Bond prices are sensitive to changes in interest rates and a rise in interest rates can cause a decline in their prices.
Foreign investing involves special risks including currency risk, increased volatility, political risks, and differences in auditing and other financial standards.
The Strategy may also invest in derivative instruments, investments whose values depend on the performance of the underlying security, assets, interest rate, index or currency and entail potentially higher volatility and risk of loss compared to traditional bond investments.
Holdings are subject to change. Totals may not sum due to rounding.
The Bloomberg U.S. TIPS Index includes all publicly issued, U.S. Treasury inflation-protected securities that have at least one year remaining to maturity, are rated investment grade, and have $250 million or more of outstanding face value.
The index is not available for direct investment.
“Bloomberg®” and the Bloomberg indexes are service marks of Bloomberg Finance L.P. and its affiliates, including Bloomberg Index Services Limited (“BISL”), the administrator of the indexes (collectively, “Bloomberg”) and have been licensed for use for certain purposes by Brown Brothers Harriman & Co (BBH). Bloomberg is not affiliated with BBH, and Bloomberg does not approve, endorse, review, or recommend the BBH Strategy.
Effective duration is a measure of the portfolio’s return sensitivity to changes in interest rates.
Credits: Obligations such as bonds, notes, loans, leases and other forms of indebtedness, except for Cash and Cash Equivalents, issued by obligors other than the U.S. Government and its agencies, totaled at the level of the ultimate obligor or guarantor of the Obligation.
Holdings and attribution information is of a single representative account (“Representative Account”) that invests in the strategy. It is managed with the same investment objectives and employs substantially the same investment philosophy and processes as the Inflation-Indexed Fixed Income Strategy.
Brown Brothers Harriman Investment Management (“IM”), a division of Brown Brothers Harriman & Co (“BBH”), claims compliance with the Global Investment Performance Standards (GIPS®). GIPS® is a registered trademark of CFA Institute. CFA Institute does not endorse or promote this organization, nor does it warrant the accuracy or quality of the content contained herein.
To receive additional information regarding IM, including a GIPS Composite Report for the strategy, contact John W. Ackler at 212 493-8247 or via email at john.ackler@bbh.com.
Gross of fee performance results for this composite do not reflect the deduction of investment advisory fees. Net of fees performance results reflect the deduction of the maximum investment advisory fees. Returns include all dividends and interest, other income, realized and unrealized gain, are net of all brokerage commissions, execution costs, and without provision for federal or state income taxes. Results will vary among client accounts. Performance calculated in U.S. dollars.
The objective of our Inflation-Indexed Fixed Income Strategy is to deliver excellent returns in excess of industry benchmarks through market cycles. The Composite included all fully discretionary, fee-paying domestic accounts over $10 million with an emphasis on U.S. inflation indexed securities. May invest up to approximately 25% outside of U.S. inflation indexed securities, and a duration of approximately 7-9 years. Accounts that subsequently fall below $9.25 million are excluded from the Composite.
There is no assurance the investment objectives will be achieved.
Brown Brothers Harriman & Co. (“BBH”) may be used to reference the company as a whole and/or its various subsidiaries generally. This material and any products or services may be issued or provided in multiple jurisdictions by duly authorized and regulated subsidiaries. This material is for general information and reference purposes only and does not constitute legal, tax or investment advice and is not intended as an offer to sell, or a solicitation to buy securities, services or investment products. Any reference to tax matters is not intended to be used, and may not be used, for purposes of avoiding penalties under the U.S. Internal Revenue Code, or other applicable tax regimes, or for promotion, marketing or recommendation to third parties. All information has been obtained from sources believed to be reliable, but accuracy is not guaranteed, and reliance should not be placed on the information presented. This material may not be reproduced, copied or transmitted, or any of the content disclosed to third parties, without the permission of BBH. All trademarks and service marks included are the property of BBH or their respective owners. © Brown Brothers Harriman & Co. 2025. All rights reserved.
Not FDIC Insured No Bank Guarantee May Lose Money
IM-16972-2025-07-23 Exp. Date 10/31/2025