The Case for Non-U.S. Investments in a Portfolio

May 15, 2020
BBH Chief Investment Officer Suzanne Brenner shares why non-U.S. investments can provide attractive opportunities.

Over the 10 years ending April 30, 2020, the S&P 500 Index returned 11.7%, outperforming the 3.6% and 1.5% returns of international developed and emerging markets equities, respectively. The same pattern of outperformance for the S&P 500 holds true during the COVID-19 crisis. Given this historical return data, it is reasonable to ask why investors should invest in non-U.S. equities at all.

There are several reasons why we believe investors should diversify their portfolios to include non-U.S. equities. Before we explore those reasons, it is important to note that Brown Brothers Harriman’s (BBH’s) portfolios have generally been overweight to U.S. large-cap equities for some time now. That positioning is not based on a top-down call, but is a result of our bottom-up research process, where we have been able to identify compelling U.S. equity managers that have capacity to take capital and create portfolios with attractive return potentials. Notwithstanding this overweight, we have also been able to identify compelling active international developed and emerging markets equities managers that make investments in a select group of individual companies that we believe can outperform U.S. large-cap equities over the long term. We prefer to invest in businesses with recurring cash flows, high-quality balance sheets and strong competitive moats whose stocks trade at discounts to their intrinsic values. In addition, when investing outside the U.S., we ensure that our managers look for adequate transparency and financial reporting, which can at times be more difficult to obtain. With a long-term view, investors should be rewarded with attractive returns from a portfolio of such high-quality companies regardless of where they are domiciled. We would also caution clients not to rely on historical returns as an indication of forward-looking returns. Our managers seek to identify businesses whose value has not yet been recognized in the prices of their stocks. In our opinion, while it is difficult to invest when returns have not been as strong, it is often the right decision that leads to compelling returns in the future.

There are several interesting data points that support investing in non-U.S. equities.

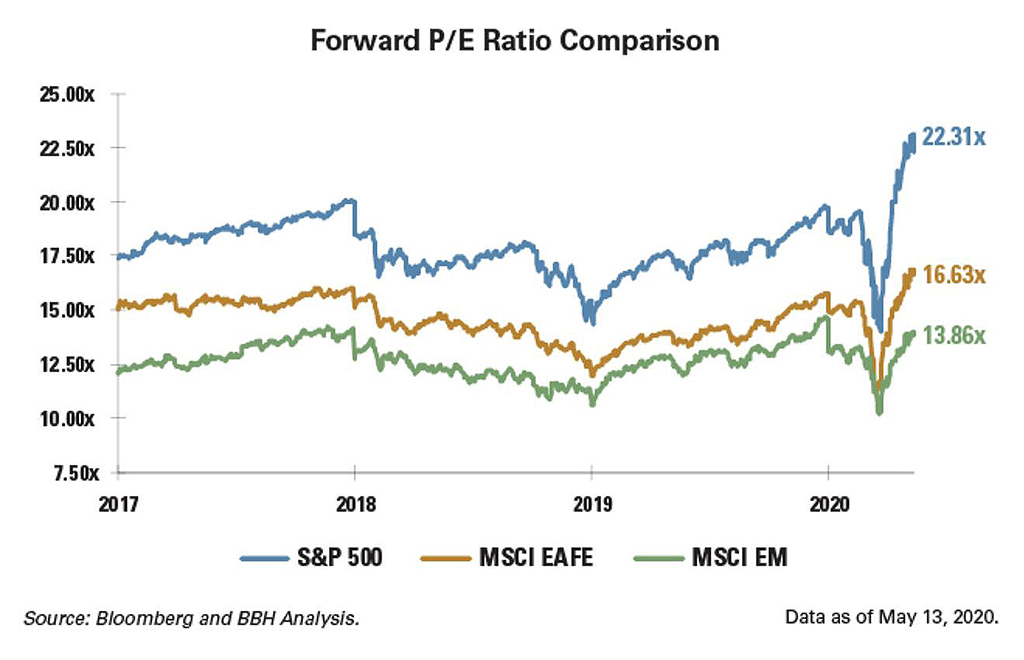
First, let’s look at the price-to-forward earnings ratios for the S&P 500, MSCI International Developed (EAFE) and MSCI Emerging Markets (EM) Indices.


This graph shows the Ratios for Selected Equity Indices: S&P consistently outperforming MSCI EAFE and MSCI from 2017 to 2020

This chart illustrates that EAFE and EM stocks in the aggregate are cheaper than U.S. large-cap stocks relative to expected 12-month forward earnings estimates. This data could signal that there are better opportunities to get attractive returns in markets outside of the U.S. In fact, many academics argue that it’s important to have portfolios of assets across global markets simply because of the diversification benefits they provide. These are fine arguments, and ones that are provided often for investing outside of the U.S., but in our minds, if we don’t think that an investor can earn returns equal to or better than what can be earned in U.S. large-cap equities, then these arguments are insufficient. In other words, we look at quantitative data (for example, price-to-earnings ratios and correlations) as starting points for capital allocation, but we don’t rely on this data in our process. Instead, we work with active managers that can identify high-quality companies across the globe that have the potential to compound capital over long periods of time.

What does the data show us? We looked at the components of the EAFE Index to determine how many stocks have outperformed the S&P 500 Index over the past 10 years as one example and found that more than 240 stocks accomplished this feat.1 The table below lists the 10 largest companies that have outperformed the S&P 500.

Company   Market Cap (USD Millions) 10-Year Return (%)
LVMH Moet Hennessy Louis Vuitton 186,365 18.65
L'Oreal SA 152,525 14.87
Novo Nordisk A/S 148,261 19.20
SA SE 144,593 13.45
AstraZeneca PLC 134,411 16.36
ASML Holding NV 119,611 30.64
NTT DOCOMO Inc 95,804 11.97
SoftBank Group Corp 90,142 16.79
CSL Ltd 89,503 27.50
Nippon Telegraph & Telephone 88,912 13.34

Highlighting the first two companies, LVMH Hennessy Louis Vuitton and L’Oréal SA, we see the world's largest luxury goods company headquartered in Paris, France, and the world’s largest beauty products company in Clichy, France. Both of these companies produce products that are used across the world and have a significant U.S. presence. In listing these stocks, we are not commenting on whether they are good investments today, but simply wish to highlight that there are a number of companies that are not located or listed in the U.S. that have outperformed the S&P 500 over 10-year periods. If these stocks are attractively valued, we believe that portfolios can benefit from having exposure to these types of businesses.

We conducted a similar analysis for emerging markets stocks looking at the components of the MSCI EM Index and found that out of the 944 stocks that have a 10-year return history, 303 outperformed the S&P 500 over the past 10 years. The five largest stocks that outperformed the S&P 500 were Tencent, Taiwan Semiconductor, Kweichow Moutai, Samsung and Ping An Insurance.

It is also interesting to look at the composition of revenues for a U.S. business and non-U.S. business that operate in a similar industry. Over time, businesses have become increasingly global, and while companies may be headquartered in different countries, their revenues are quite diversified across the globe. To illustrate this concept, we show two businesses – Oracle and SAP – and their headquarters, the primary exchanges on which they are traded and their revenue compositions by region.

Company   Headquarters/Exchange   Revenue Region    % of Revenue
Oracle   California/NYSE   U.S.      53%
    International    47%
SAP     Germany/Xetra       U.S.  33%
     International   67%

Oracle is headquartered in California, and the company provides products and services that address enterprise information technology needs worldwide. SAP, headquartered in Germany, provides similar and often competing products and services. Both companies are multinational in nature, and they both have substantial revenues in and outside of the U.S. In terms of returns, over the past 10 years, SAP has outperformed Oracle, generating a return of 11.3% (in USD) compared to 8.9%.2 Given that these are both high-quality companies in the same industry that can compound capital at attractive rates of return, we see no reason to eliminate SAP simply because it is not domiciled in the U.S.

Another way of looking at this question is to focus on companies with similar business models that are dominant in their home countries.

Company Headquarters/Exchange Non-U.S. Company Headquarters/ Exchange Business Category
Facebook   California/Nasdaq    Tencent China/Hong Kong Social Media and Digital Advertising
Amazon   Washington/Nasdaq     Alibaba   China/Hong Kong Internet Infrastructure and Ecommerce

The table above highlights several dominant companies in two distinct business categories. For example, Facebook (located in the U.S.) and Tencent (in China) are both businesses that are the dominant social media provider in their home markets. Amazon and Alibaba are both dominant ecommerce companies in the U.S. and China. Often, certain business models produce local champions rather than a single dominant global player, and investors can leverage their understanding of one business to evaluate other similar business models in other geographies. We would not want to exclude a dominant domestic company with a strong business model from our investment universe simply because it operated in a market outside the U.S.

A final consideration when investing in non-U.S. companies is related to currency. U.S. investors holding a stock in a non-U.S. currency will have either gains or losses relating to currency moves. For example, if a stock in Europe is worth €100 at the time of purchase (with an exchange rate of 1.20 U.S. dollars per euro), then the dollar price will be $120. If one year later the exchange rate is 1.10 U.S. dollars per euro, and the stock is still priced at €100, the dollar price will be $110, and you will have a translation loss of 8.3% for the year. Unfortunately, looking back over the past 10 years, the dollar has strengthened significantly across most non-U.S. currencies and has resulted in a not insignificant portion of the underperformance of EAFE and EM Indices relative to the S&P 500 Index – 1.5% and 3.2%, respectively. However, that data is backward-looking. Notably, there have been many periods in which the U.S. dollar has weakened relative to a basket of non-U.S. currencies, and when that happens, the translation losses revert to translation gains. For example, in the period from March 2002 through March 2008, the MSCI EAFE Net USD Index outperformed the S&P 500 by roughly 8% annually, with virtually all of that difference coming from currency.3 Furthermore, over long-term periods, currency impact is typically more negligible. From January 1973 to December 2019, the foreign exchange value of the dollar trade-weighted index fell 0.37% annually against major global currencies.4 The index was normalized to a value of $100 in 1973 and traded as high as $143 in 1985 and as low as $69 in 2011, but over the full period, the U.S. dollar actually lost value.

In the end, at BBH, we believe it is important to go back to first principles – that investment returns over time are driven by a company’s future cash flows and cash flow growth. Therefore, we do not have a preference for where a business is domiciled as long as it meets the investment criteria we have set forth. Importantly, successful investing across all equities requires clients to filter out short-term noise and price volatility in order to remain invested and let the wonder of compounding create long-term wealth.

Past performance does not guarantee future results.

International investing involves special risks including currency risk, increased volatility, political risks, and differences in auditing and other financial standards. Prices of emerging market securities can be significantly more volatile than the prices of securities in developed countries, and currency risk and political risks are accentuated in emerging markets. Investing in medium sized companies typically exhibit greater risk and higher volatility than larger, more established companies.

Opinions, forecasts, and discussions about investment strategies represent the author's views as of the date of this commentary and are subject to change without notice. References to specific securities, asset classes, and financial markets are for illustrative purposes only and are not intended to be, and should not be interpreted as recommendations.

The  S&P 500 is an unmanaged weighted index of 500 stocks providing a broad indicator of price movements.

The Morgan Stanley Capital International EAFE Index is an unmanaged measure of the international stock market performance in 21 developed markets countries.

The Morgan Stanley Capital International Emerging Markets Index captures large and mid-cap representation across 23 markets countries.


1 Source: Bloomberg and BBH Analysis. Ten-year returns as of April 30. 2020. Past performance does not guarantee future results.
2 Returns for the 10-year period ending April 30, 2020, in USD. Past performance does not guarantee future results.
3 Source: Bloomberg. From March 28, 2002 through March 31, 2008, the S&P 500 Index returned an annualized 4.3%, the MSCI EAFE Net Local returned 4.4%, and the MSCI EAFE Net USD returned 12.4%.
4 Source: Bloomberg. U.S. Trade-Weighted Major Currency Dollar Index.

Brown Brothers Harriman & Co. (“BBH”) may be used to reference the company as a whole and/or its various subsidiaries generally. This material and any products or services may be issued or provided in multiple jurisdictions by duly authorized and regulated subsidiaries. This material is for general information and reference purposes only and does not constitute legal, tax or investment advice and is not intended as an offer to sell, or a solicitation to buy securities, services or investment products. Any reference to tax matters is not intended to be used, and may not be used, for purposes of avoiding penalties under the U.S. Internal Revenue Code, or other applicable tax regimes, or for promotion, marketing or recommendation to third parties. All information has been obtained from sources believed to be reliable, but accuracy is not guaranteed, and reliance should not be placed on the information presented. This material may not be reproduced, copied or transmitted, or any of the content disclosed to third parties, without the permission of BBH. All trademarks and service marks included are the property of BBH or their respective owners. © Brown Brothers Harriman & Co. 2022. All rights reserved. PB-05354-2022-05-12

As of June 15, 2022 Internet Explorer 11 is not supported by BBH.com.

Important Information for Non-U.S. Residents

You are required to read the following important information, which, in conjunction with the Terms and Conditions, governs your use of this website. Your use of this website and its contents constitute your acceptance of this information and those Terms and Conditions. If you do not agree with this information and the Terms and Conditions, you should immediately cease use of this website. The contents of this website have not been prepared for the benefit of investors outside of the United States. This website is not intended as a solicitation of the purchase or sale of any security or other financial instrument or any investment management services for any investor who resides in a jurisdiction other than the United States1. As a general matter, Brown Brothers Harriman & Co. and its subsidiaries (“BBH”) is not licensed or registered to solicit prospective investors and offer investment advisory services in jurisdictions outside of the United States. The information on this website is not intended to be distributed to, directed at or used by any person or entity in any jurisdiction or country where such distribution or use would be contrary to law or regulation. Persons in respect of whom such prohibitions apply must not access the website.  Under certain circumstances, BBH may provide services to investors located outside of the United States in accordance with applicable law. The conditions under which such services may be provided will be analyzed on a case-by-case basis by BBH. BBH will only accept investors from such jurisdictions or countries where it has made a determination that such an arrangement or relationship is permissible under the laws of that jurisdiction or country. The existence of this website is not intended to be a substitute for the type of analysis described above and is not intended as a solicitation of or recommendation to any prospective investor, including those located outside of the United States. Certain BBH products or services may not be available in certain jurisdictions. By choosing to access this website from any location other than the United States, you accept full responsibility for compliance with all local laws. The website contains content that has been obtained from sources that BBH believes to be reliable as of the date presented; however, BBH cannot guarantee the accuracy of such content, assure its completeness, or warrant that such information will not be changed. The content contained herein is current as of the date of issuance and is subject to change without notice. The website’s content does not constitute investment advice and should not be used as the basis for any investment decision. There is no guarantee that any investment objectives, expectations, targets described in this website or the  performance or profitability of any investment will be achieved. You understand that investing in securities and other financial instruments involves risks that may affect the value of the securities and may result in losses, including the potential loss of the principal invested, and you assume and are able to bear all such risks.  In no event shall BBH or any other affiliated party be liable for any direct, incidental, special, consequential, indirect, lost profits, loss of business or data, or punitive damages arising out of your use of this website. By clicking accept, you confirm that you accept  to the above Important Information along with Terms and Conditions.

 
1BBH sponsors UCITS Funds registered in Luxembourg, in certain jurisdictions. For information on those funds, please see bbhluxembourgfunds.com


captcha image

Type in the word seen on the picture

I am a current investor in another jurisdiction